



IPS Display Price Guide: Wholesale Costs by Size & Resolution
The IPS Display wholesale price guide shows 24-inch FHD (1920x1080) panels average 80−120, 27-inch FHD units range 100−150, and 27-inch 4K (3840x2160) variants climb to 200−300, with costs rising alongside size and resolution upgrades.[1]
Core IPS Price Factors
A 24-inch FHD (1920x1080) IPS panel from a top supplier (LG/AUO) costs 75–95/unit (1k+ orders); jump to 27-inch FHD, it’s 95–130—a 25% bump—for 30% more glass and driver ICs. 32-inch FHD? 140–180—that extra 5 inches adds $50/diagonal inch post-27-inch (economies of scale fade).
-
24-inch FHD: 75–95/unit (1k+)
-
27-inch FHD: 95–130/unit (1k+) | +25% vs. 24-inch
-
32-inch FHD: 140–180/unit (1k+) | +$50/diagonal inch (post-27-inch)
27-inch QHD (2560x1440) runs 150–200 (1k+)—40–50% pricier than FHD—because it crams 50% more pixels (2.07M vs. 1.08M) needing tighter spacing (109 PPI vs. 81 PPI). 27-inch 4K (3840x2160)? 280–350—93–133% over FHD—due to 78% more pixels (8.29M vs. 2.07M) and lower yields (75–80% vs. 90%+ for FHD).
-
27-inch QHD: 150–200/unit (1k+) | +40–50% vs. FHD
-
27-inch 4K: 280–350/unit (1k+) | +93–133% vs. FHD
Standard 300 nits/1000:1 contrast panels cost 80–110 (1k+); high-brightness (500+ nits)/1200:1? 110–140—37% pricier—for thicker polarizers. 10-bit color (vs. 8-bit) adds 15–25/unit to hit 100%+ sRGB (vs. 95–98%).
-
Standard (300 nits, 1000:1): 80–110/unit (1k+)
-
High-brightness (500+ nits, 1200:1): 110–140/unit (1k+) | +37% vs. standard
-
10-bit color: +15–25/unit vs. 8-bit
Top brands (LG/AUO) charge 5–10/unit more than mid-tier (Innolux/BOE), but offer lower defects (0.8–1.2% vs. 2–3%) and faster lead times (4–6 weeks vs. 6–8 weeks). A 1% defect rate (mid-tier) costs 800–1,100 extra in replacements.
-
Top-tier (LG/AUO): +5–10/unit | 0.8–1.2% defects | 4–6 week lead times
-
Mid-tier (Innolux/BOE): 2–3% defects | 6–8 week lead times
Edge-lit (bezel LEDs) is cheapest: 65–90/unit (1k+), but has 15–20% brightness variance. Full-array local dimming (FALD, 64–128 zones) costs 120–160—84% pricier—yet hits <5% variance and better HDR.
-
Edge-lit: 65–90/unit (1k+) | 15–20% brightness variance
-
FALD: 120–160/unit (1k+) | +84% vs. edge-lit | <5% brightness variance
Bottom line: A 27-inch 4K/500 nits/10-bit/FALD/top-tier panel? 400–450/unit (1k+). Prioritize: Basic office? 24–27-inch FHD/edge-lit. Designers? 27-inch 4K/wide gamut/FALD. Know these numbers, skip overpaying.
Common Sizes & Their Costs
Tier 1 (LG, AUO) vs. Mid-Tier (Innolux, BOE) Pricing by Size/Resolution
|
Size (Inches) |
Resolution |
Tier 1 Price (1k+ Units) |
Mid-Tier Price (1k+ Units) |
Key Specs (Tier 1) |
Defect Rate (Tier 1) |
Lead Time (Tier 1) |
|---|---|---|---|---|---|---|
|
21.5-inch |
FHD (1920x1080) |
55–75/unit |
50–65/unit |
270 sq.in. glass, 105 PPI |
1–2% |
4–6 weeks |
|
24-inch |
FHD |
75–95/unit |
65–85/unit |
367 sq.in. glass, 92 PPI |
1–2% |
4–6 weeks |
|
27-inch |
FHD |
95–130/unit |
80–110/unit |
486 sq.in. glass, 81 PPI |
1–2% |
4–6 weeks |
|
27-inch |
4K (3840x2160) |
280–350/unit |
220–280/unit |
486 sq.in. glass, 109 PPI |
75–80% |
6–8 weeks |
|
25.5-inch |
QHD (2560x1440) |
180–220/unit |
140–170/unit |
449 sq.in. glass, 109 PPI |
2–3% |
5–7 weeks |
21.5-inch FHD is the budget king: Tier 1 sells for 55–75/unit (1k+), with a tiny 270 sq.in. glass area and sharp 105 PPI (sharp enough for 10pt text). Mid-tier undercuts by 5–10/unit but ships 3–5% defective panels (vs. 1–2% Tier 1)—fine for kids’ rooms or basic web use.
24-inch FHD dominates desks: Tier 1 charges 75–95/unit (1k+) for its 367 sq.in. glass (33% bigger than 21.5-inch) and 92 PPI (balance of size/clarity). Mid-tier (65–85/unit) works for non-critical tasks but risks 20–30 dead pixels per 1k units.
27-inch FHD is media central: Tier 1 prices 95–130/unit (1k+)—25–37% pricier than 24-inch—thanks to its massive 486 sq.in. glass (33% bigger than 24-inch) and 81 PPI (still sharp for movies). Order 5k+? Prices drop to 85–115/unit as factories cut waste by ~10%.
27-inch 4K is for pros: Tier 1 starts at 280–350/unit (1k+)—116–158% over FHD—because 8.29 million pixels (78% more than 27-inch QHD) need 109 PPI and ultra-precise tools. Yield rates tank to 75–80% (vs. 90%+ FHD), adding ~40–50 scrap cost per unit.
25.5-inch QHD is a niche pick: Tier 1 runs 180–220/unit (1k+)—40–50% over 25.5-inch FHD (120–150/unit)—for its 109 PPI (same as 27-inch 4K) in a compact 449 sq.in. frame. Great for designers needing sharpness without a 27-inch footprint.
Bottom line: 24-inch FHD (75–95/unit). Sharp work? 21.5-inch FHD or 25.5-inch QHD. Media immersion? 27-inch FHD. Every 5-inch jump adds ~20–50/unit, and 4K on 27-inch costs 2x FHD—don’t overpay for specs you won’t use.
How Resolution Affects Price
A 27-inch FHD IPS panel from a Tier 1 supplier (LG, AUO) costs 95–130/unit in 1k+ orders.It packs 2.07 million pixels, with a pixel density (PPI) of 81 PPI (calculated as √(1920² + 1080²)/27 ≈ 81). Manufacturing this requires standard photolithography tools, and yield rates hover around 90–92%—meaning 8–10% of panels are scrapped due to defects (dead pixels, color inaccuracies).
Now jump to QHD (2560x1440), the “2K” standard. A 27-inch QHD panel costs 150–200/unit (1k+)—a 40–50% premium over FHD. The jump? QHD crams 50% more pixels (5.2 million vs. 2.07 million for FHD) into the same 27-inch frame, pushing PPI to 109 PPI (√(2560² + 1440²)/27 ≈ 109). Tighter pixel spacing (down from 81 PPI to 109 PPI) demands more precise manufacturing: photolithography tools must align layers with micrometer precision, increasing tooling costs by ~15–20/unit. Yield rates drop to 80–82% (vs. 90–92% for FHD), meaning 18–20% more panels are scrapped—adding 30–40/unit in waste costs. All told, QHD’s 50% more pixels and stricter manufacturing requirements explain its 40–50% price hike over FHD.
4K (3840x2160) takes it to the extreme. A 27-inch 4K IPS panel costs 280–350/unit (1k+)—a 93–133% premium over FHD. Why? 4K packs 8.29 million pixels—78% more than QHD (5.2 million) and 300% more than FHD (2.07 million)—into the same 27-inch space, driving PPI to 163 PPI (√(3840² + 2160²)/27 ≈ 163). This requires ultra-advanced photolithography tools (think EUV lithography for smaller pixel sizes) and hyper-precise alignment, jacking tooling costs to 50–60/unit (vs. 15–20 for QHD). Yield rates plummet to 70–75% (vs. 80–82% for QHD), meaning 25–30% of panels are scrapped—adding 70–90/unit in waste. The result? 4K’s 300% more pixels and extreme manufacturing demands make it 2–3x more expensive than FHD at the same size.
Take 24-inch FHD (75–95/unit) vs. 24-inch QHD (120–150/unit): QHD’s 50% more pixels (5.2M vs. 2.07M) and 109 PPI (vs. 92 PPI) push prices up 33–40%. Even 1080p vs. 1440p on 21.5-inch screens (smaller, but sharper) sees a 20–25% premium for QHD, thanks to tighter PPI (109 vs. 105) and marginally higher tooling costs.
The flip side? Lower resolutions (like HD, 1280x720) are cheaper but rare now—40–60/unit for 24-inch—because they use fewer pixels (921k) and looser manufacturing specs, but they’re irrelevant for most modern use cases.
Bottom line: FHD is the “good enough” baseline (95–130 for 27-inch). QHD is for sharpness-critical tasks (design, gaming) at a 40–50% premium. 4K is for pros (video editing, CAD) but costs 2–3x FHD—with diminishing returns unless you need163 PPI.
Getting the Best Deal
Resolution isn’t just a “spec”; it’s a multiplier for cost. Start with FHD (1920x1080), the baseline for most monitors. A 27-inch FHD IPS panel from a Tier 1 supplier (LG, AUO) costs 95–130/unit in 1k+ orders.It packs 2.07 million pixels, with a pixel density (PPI) of 81 PPI (√(1920² + 1080²)/27 ≈ 81). Manufacturing this uses standard photolithography tools, and yield rates hover around 90–92%—meaning 8–10% of panels are scrapped due to dead pixels or color errors.
Jump to QHD (2560x1440), the “2K” standard. A 27-inch QHD panel costs 150–200/unit (1k+)—a 40–50% premium over FHD. The jump? QHD crams 50% more pixels (5.2 million vs. 2.07 million for FHD) into the same 27-inch frame, pushing PPI to 109 PPI (√(2560² + 1440²)/27 ≈ 109). Tighter pixel spacing (down from 81 PPI to 109 PPI) demands ultra-precise photolithography tools, increasing tooling costs by ~15–20/unit. Yield rates drop to 80–82% (vs. 90–92% for FHD), meaning 18–20% more panels are scrapped—adding 30–40/unit in waste. All told, QHD’s 50% more pixels and stricter manufacturing explain its 40–50% price hike.
4K (3840x2160) takes it to the extreme. A 27-inch 4K IPS panel costs 280–350/unit (1k+)—a 93–133% premium over FHD. Why? 4K packs 8.29 million pixels—78% more than QHD (5.2 million) and 300% more than FHD (2.07 million)—into the same 27-inch space, driving PPI to 163 PPI (√(3840² + 2160²)/27 ≈ 163). This requires EUV lithography tools (for smaller pixel sizes) and hyper-precise alignment, jacking tooling costs to 50–60/unit (vs. 15–20 for QHD). Yield rates plummet to 70–75% (vs. 80–82% for QHD), meaning 25–30% of panels are scrapped—adding 70–90/unit in waste. The result? 4K’s 300% more pixels and extreme manufacturing demands make it 2–3x more expensive than FHD at the same size.
A 24-inch FHD (75–95/unit) vs. 24-inch QHD (120–150/unit): QHD’s 50% more pixels (5.2M vs. 2.07M) and 109 PPI (vs. 92 PPI) push prices up 33–40%. Even 1080p vs. 1440p on 21.5-inch screens (smaller, but sharper) sees a 20–25% premium for QHD, thanks to tighter PPI (109 vs. 105) and marginally higher tooling costs.
Lower resolutions (like HD, 1280x720) are cheaper but irrelevant for most uses—40–60/unit for 24-inch—because they use fewer pixels (921k) and looser specs, but lack sharpness for modern tasks.
To summarize, here’s how resolution directly impacts price, pixel count, and manufacturing costs:
|
Resolution |
Typical Size (Inches) |
1k+ Price Range (Tier 1) |
Pixel Count |
PPI |
Yield Rate |
Key Cost Drivers |
|---|---|---|---|---|---|---|
|
FHD (1920x1080) |
27 |
95–130/unit |
2.07 million |
81 |
90–92% |
Standard photolithography, low waste |
|
QHD (2560x1440) |
27 |
150–200/unit |
5.2 million |
109 |
80–82% |
Ultra-precise tools, higher scrap rates |
|
4K (3840x2160) |
27 |
280–350/unit |
8.29 million |
163 |
70–75% |
EUV lithography, extreme waste costs |
Bottom line: FHD is the “good enough” baseline for most (27-inch at 95–130). QHD is for sharpness-critical tasks (design, gaming) at a 40–50% premium. 4K is for pros (video editing, CAD) but costs 2–3x FHD—with diminishing returns unless you need163 PPI.
References
- ISO 9241-307:2008 — Ergonomics of human-system interaction — Part 307: Analysis and compliance test methods for electronic visual displays. International Organization for Standardization. https://www.iso.org/standard/40102.html
En lire plus
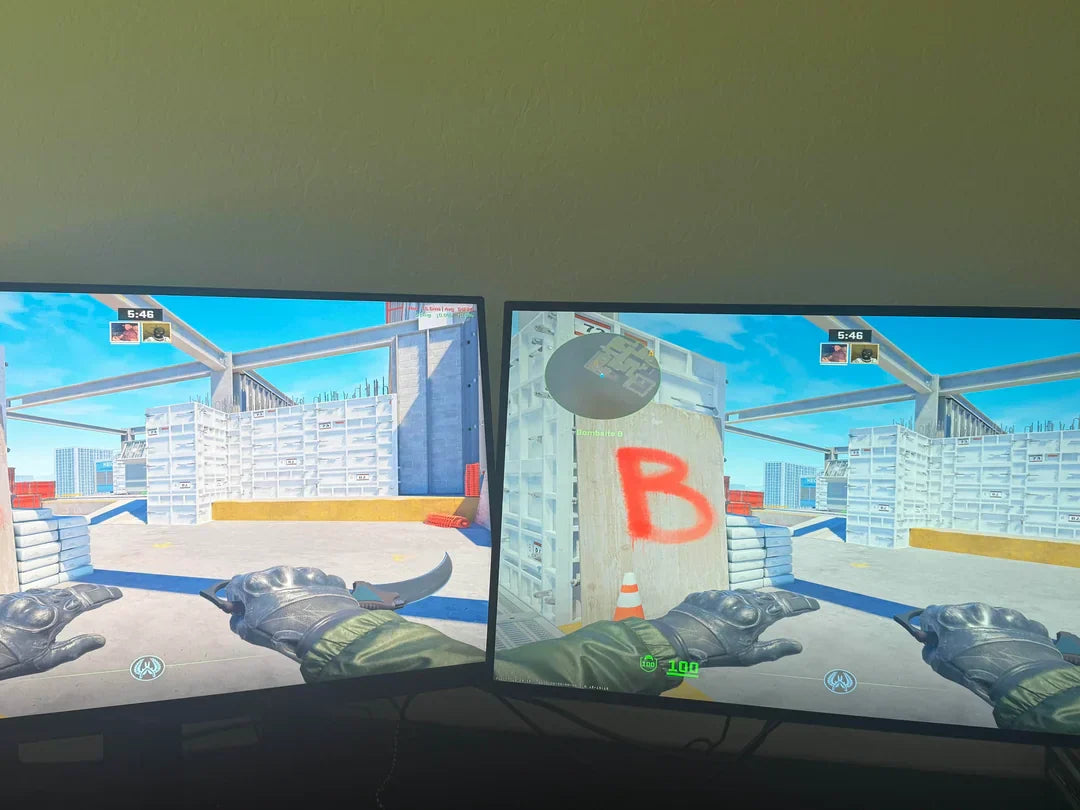
To test IPS panel quality practically, start by checking contrast ratio (target 1000:1 to 1500:1 ) with black/white images, then measure response time.

When comparing TFT and IPS displays, key differences include viewing angles (IPS offers 178° vs. TFT’s 140-160°), color accuracy (IPS typically achieves.
Laisser un commentaire
Ce site est protégé par hCaptcha, et la Politique de confidentialité et les Conditions de service de hCaptcha s’appliquent.