


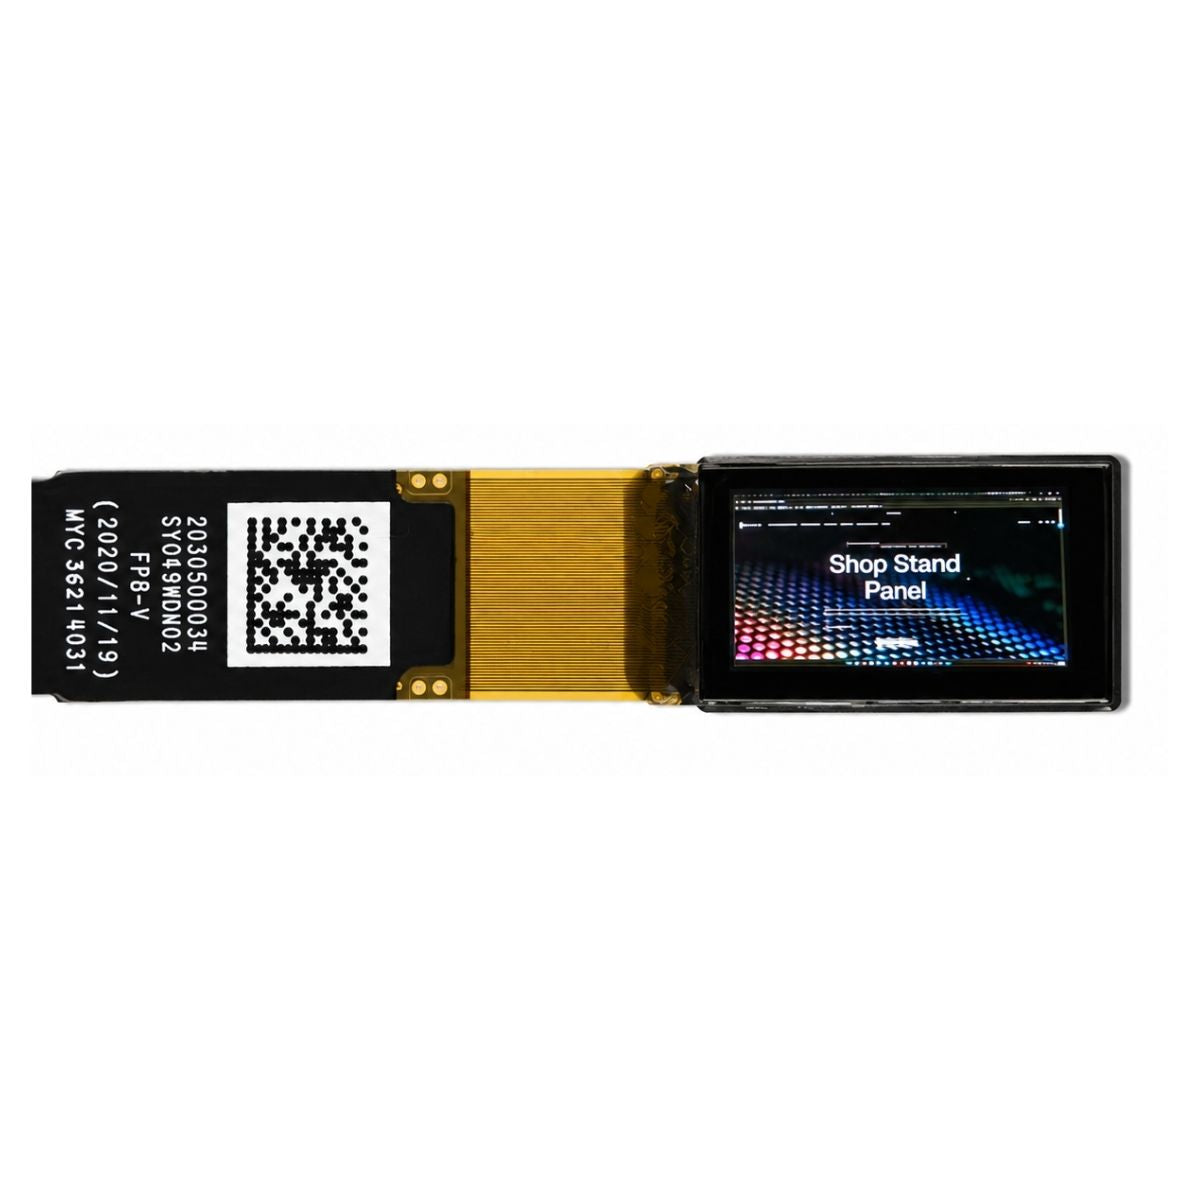


Industrial TFT LCD | Sunlight Readable, Wide Temperature & Long Life
For industrial TFTs, choose a sunlight-readable IPS panel with brightness above 1000 nits, an operating temperature of -30 to 85°C, and a backlight lifetime of ≥50,000 hours;
Before installation, perform a 24-hour burn-in and then reduce the LED current by 10% to extend lifetime.
Sunlight Readable
Outdoor strong-light illuminance often reaches 10,000 to 100,000 lux.
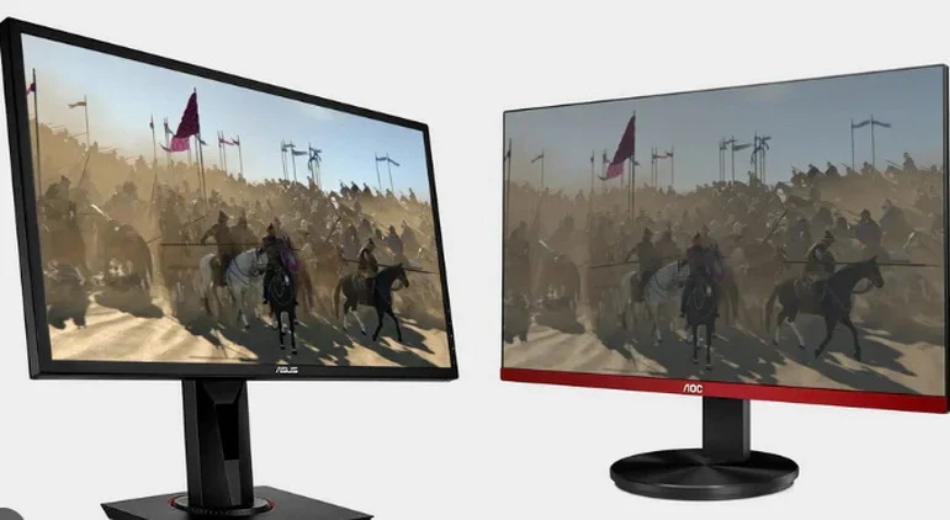
A typical 300-nit display, due to surface reflections, can see its effective contrast drop below 1:1, making content unreadable.
Industrial Sunlight Readable LCDs use high-efficiency LED backlights, with brightness spanning 800 to 2500 nits.
Combined with optical bonding to eliminate air gaps, and an AR coating to reduce surface reflectance down to 0.2% to 0.5%.
This ensures that, under direct sunlight, effective contrast remains above 5:1, meeting the 7x24 all-weather display requirements for outdoor HMIs, marine navigation, and public kiosks.
How to Choose a Brightness Level
Start with the Illuminance
Outdoor lighting varies greatly: full daylight on an overcast day is commonly 10,000 to 25,000 lux, while direct sunlight can reach 32,000 to 100,000 lux.
For the same device, moving it from a shaded parking area to an unshaded deck can completely change readability.
What “nit” means
The nits (also written as cd/m2) in a spec indicate the display’s own luminance, not the contrast you perceive with your eyes. Most “washed-out” appearance comes from cover-glass reflections raising the black level.
- Indoors, 300 to 500 nits is often sufficient
- Semi-outdoor (canopies, baffles) commonly needs 800 to 1200 nits
- Fully exposed direct sun: many projects target 1500 to 2500 nits, paired with low-reflection cover glass
Reflection math
A simple estimate helps you choose the right brightness tier more precisely: reflected luminance is roughly “illuminance × reflectance ÷ about 3.14,” which is a commonly used relationship between illuminance and reflected luminance.
Plugging in the numbers, you’ll find that “just piling on nits” is often not cost-effective.
| Scene illuminance | Cover-glass reflectance | Estimated reflected luminance | What it means for you |
|---|---|---|---|
| 100000 lux (direct sun) | 4% (typical bare glass) | ~1270 nits | With a 1000-nit display, blacks quickly turn gray |
| 100000 lux (direct sun) | 0.5% (common AR target) | ~160 nits | A 1000-nit display can retain readable contrast margin |
| 25000 lux (bright overcast) | 1% (conservative AR) | ~80 nits | 800 to 1000 nits is usually enough |
How to choose among three tiers
Write down your most common usage locations and choose accordingly—this saves more time than asking “do we need 2000 nits.”
- Sheltered outdoor (terminals outside gas stations, warehouse docks, street-side areas shaded by tall buildings)
- On-site commonly 5000 to 20000 lux
- Recommendation: 800 to 1200 nits + AG or light AR
- Note: if glass reflectance is still at ~4%, even 1200 nits will be partially “eaten” by reflections
- Open outdoor (seaside docks, desert highways, mountain worksites, almost no shade)
- On-site commonly 20000 to 100000 lux
- Recommendation: 1500 to 2500 nits + low-reflection AR (often achievable to <0.5%)
- Ask clearly whether brightness is “panel native” or “front-of-glass brightness after bonding the cover glass.” With the same 1500-nit claim, front-of-glass can differ by 10% to 30%.
- Strong light + polarization (in-vehicle, marine dashboards; users may wear polarized sunglasses)
- Beyond nits, consider the polarizer orientation relative to the sunglasses’ axis
- In automotive display metrology standards such as SAE J1757-1, “high ambient contrast” is a key measurement item.
- When purchasing, ask the supplier for a readability validation method “under polarized conditions”—don’t accept only a brightness curve.
Content design also matters
Even at the same 1000 nits, UI color choices can make readability very different:
- White text on black: text is crisp, but blacks are more easily lifted by reflections; it depends more on low-reflection cover glass
- Dark text on light background: more stable against reflections, but higher average backlight power consumption due to large white areas
- Thin-line icons: require higher effective contrast; under direct sun, it’s better to thicken lines by 1–2 px than to only increase brightness
Leave some margin
- Brightness you receive is not constant: backlights decay over time. Many projects specify that “minimum readable brightness at end-of-life” must still be met, so initial brightness often includes a 20% to 30% margin.
- High temperature reduces backlight efficiency; luminance drops at the same current. In high-insolation locations like Florida docks or Nevada deserts, thermal design determines whether you can sustain maximum brightness long-term.
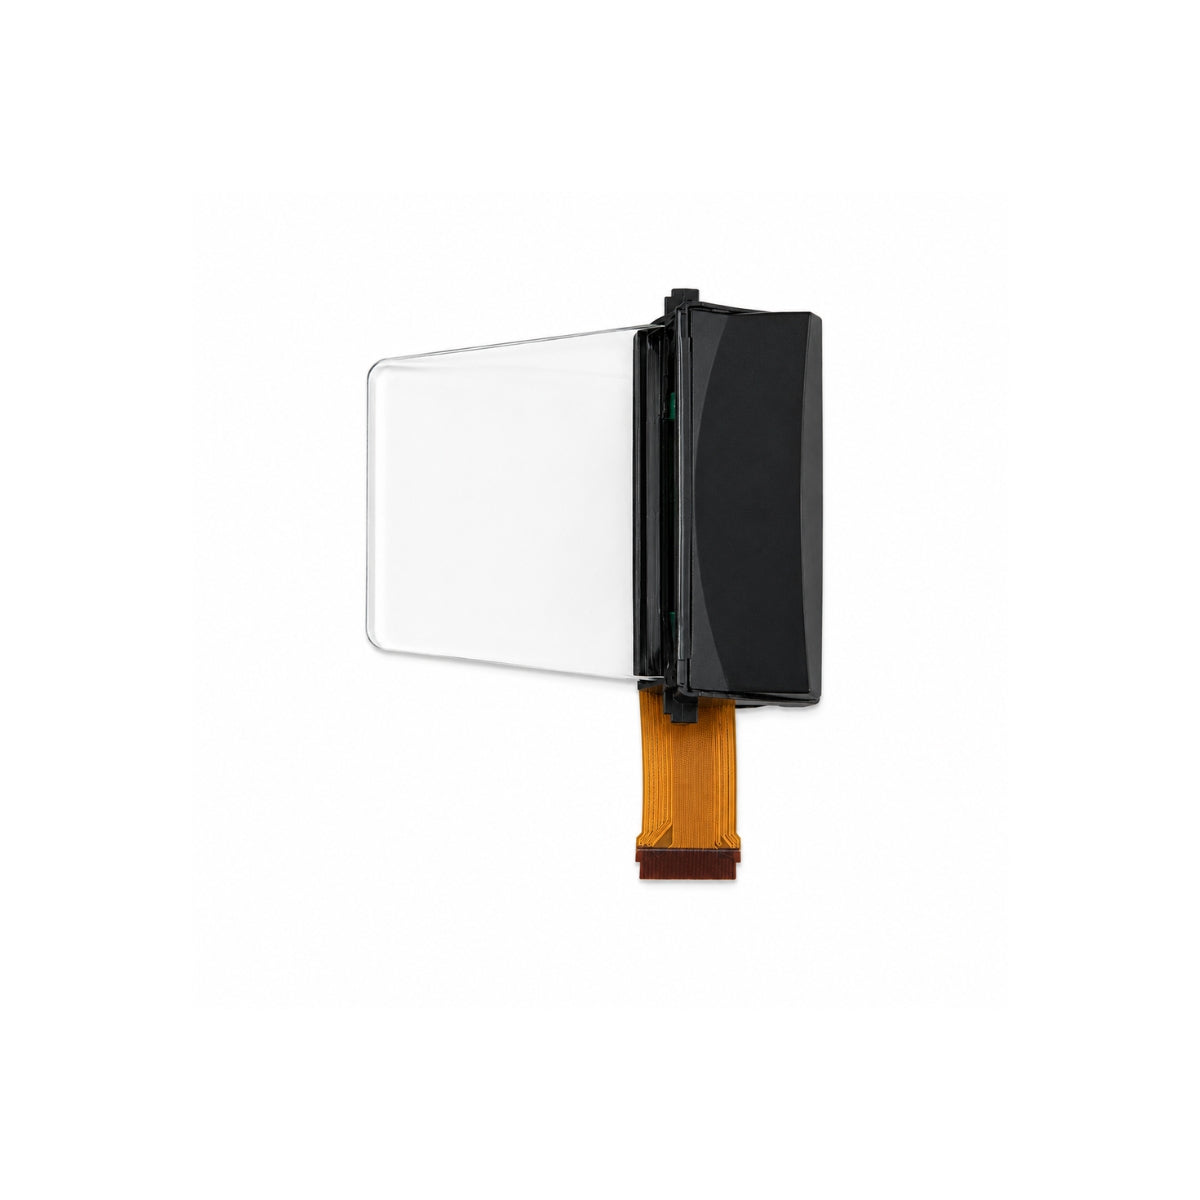
Optical Bonding Process
First, understand the three-piece stack you’re bonding
In common stacks, adhesive thickness typically falls in the range of 50 to 250 μm (film OCA) or 100 to 1000 μm (liquid LOCA).
Too thin makes small warpage amplify into stress; too thick increases risks like edge overflow and curing-shrinkage displacement.
Material CTE mismatch must be built into the process window: glass is typically 8 to 10 ppm/°C, while some plastic cover plates can exceed 40 ppm/°C.
The adhesive’s modulus and viscoelastic properties determine whether thermal cycling causes whitening, light leakage, or haze.
Don’t pick the adhesive blindly
It’s recommended to gate adhesive optical specs with hard thresholds: at ~550 nm, a common target is ≥98% transmittance, haze controlled below 0.5%, and refractive index usually in the 1.47 to 1.52 range, aiming to match glass and transparent substrates and reduce interface reflections.
Yellowing should be supported by quantifiable aging data: after 1000 hours of UV aging, keeping the change in yellowness index within 2 is more robust;
after 85°C/85%RH for 500 hours, it’s better if transmittance drop is no more than 1%.
Bond strength should be defined with both initial and post-aging metrics: a common lower limit is 0.5 MPa shear strength after 24 hours at room temperature;
retaining ≥0.3 MPa after damp-heat aging helps prevent edge creep or delamination.
On-site: don’t give dust a chance
Work areas commonly target ISO Class 5 to Class 7. Personnel motion and fixture friction can bring particles into the interface.
Don’t rely only on air guns for de-dusting; ionized air combined with tack rollers is more stable.
Reducing electrostatic voltage to within a few hundred volts can significantly reduce dust attraction.
Environment is recommended at 22 to 26°C and 40% to 55% RH—helpful for static control without overly promoting moisture absorption/expansion in polarizers and adhesive materials.
Moisture management from storage to line-start should be quantified: baking cover glass at 70 to 80°C for 1 to 2 hours before feeding can remove adsorbed surface moisture;
For organic thin-sheet substrates, temperature should be more conservative—commonly 40 to 50°C—to avoid warpage.
Don’t skimp on surface preparation
Quantifying surface energy with contact angle or dyne pens makes execution easier: surface energy above 38 mN/m is more likely to achieve stable wetting; keeping contact angle below 60° is usually safer.
Plasma or corona treatment can raise energy, but overdoing it can introduce micro-etching and increase haze, making the display look “gray.”
The interval from treatment to bonding must also be controlled—too long and the surface “relaxes” back.
A common practice is to connect within 30 minutes to reduce variability.
Don’t align by “feel”
With conventional bezels, controlling X/Y shift within ±0.10 mm is relatively achievable;
For narrow bezels or modules needing high concentricity, X/Y may be tightened to ±0.05 mm, and rotation controlled within 0.05°, requiring high-resolution cameras and stable fixtures.
Fixture flatness and suction uniformity affect final offset; keeping zoned vacuum pressure difference within 5 kPa helps avoid deforming thin parts.
How to tune the laminator to avoid bubbles
Vacuum level is recommended at ~100 Pa or lower, with a hold time of 30 to 120 seconds to allow adhesive flow.
Lamination pressure is often 0.3 to 0.6 MPa, speed 20 to 80 mm/s.
Too fast traps edge air into long bubbles; too slow can leave flow marks due to excessive local dwell time.
For large parts, staged pressing is more stable than a single full stroke; a center-to-edge path pushes gas toward the perimeter.
If fine residual microbubbles remain after lamination, secondary de-bubbling can use a pressure tank: 0.6 to 0.8 MPa, 45 to 55°C, 20 to 40 minutes is common.
As temperature rises, adhesive viscoelasticity decreases and microbubbles shrink/disappear more easily.
How to dispense liquid adhesive without it running everywhere
Recommended to control dispensing volume with percentage metrics: keeping single-part consumption variation within ±2% helps prevent edge overflow or center voids.
Viscosity is typically 2000 to 8000 mPa·s. Too low flows into the blackout area; too high leaves flow marks and trapped air.
Vacuum de-gassing before dispensing reduces mixed-in air; 10 to 20 minutes with vacuum down to a few hundred Pa is common.
UV curing is not “just shine a light”
LOCA is commonly cured at 365 to 405 nm, and dose should be managed in mJ/cm².
Common dose range is 2000 to 4000 mJ/cm². Too low leaves residual monomer leading to later haze and strength loss; too high can cause local temperature rise, stress, and misalignment.
Black matrix ink edges and metal-frame shadow zones reduce exposure; edges often end up semi-cured and tacky.
Solutions include adding side illumination, extending exposure, or using two-stage curing.
A post-bake at 60°C for 1 to 2 hours after UV can drive remaining reactions to completion, improving shear-strength stability.
How to define acceptance criteria so you don’t argue later
In the active area, bubble count can be set to 0; allowing micro-point defects with diameter <0.2 mm and quantity 0 makes later disputes easier to avoid;
In the non-display area, you can relax to diameter 0.3 mm and ≤2 defects, but set a minimum distance from the active-area boundary, e.g., ≥1 mm.
Newton rings and interference patterns should be judged together with polarizer angle, refractive-index matching, and adhesive-thickness variation.
Thickness uniformity is recommended to be sampled by thickness measurement or white-light interferometry, keeping thickness dispersion within about ±10 μm for higher confidence.
Modules with reflectance in the 1% to 2% range usually look better outdoors, but rely on the AR coating system and refractive-index matching.
Surface Treatment Comparison
First, say what effect you want
In optical bonding, coating, printing, and film deposition, surface treatment goals generally fall into two types:
One is to remove contaminants so adhesive or coating can wet and spread;
The other is to raise surface energy so chemical bonding or physical interlocking is stronger.
When evaluating, don’t only check “was it treated”; include quantifiable metrics: surface energy commonly targets 38 to 50 mN/m;
Lowering water contact angle from 80–95° down to 30–60° significantly improves wetting;
On glass, roughness Ra is typically 1 to 5 nm; after roughening it may rise to 20 to 100 nm—too high will increase haze.
First, get rid of the dirt
Solvent wiping is a low-threshold option. IPA or ethanol systems with lint-free wipes can remove fingerprints, silicone oils, and mild particles, but are limited for cured residue and some mold-release agents.
A common control metric on-site is: after wiping, particle count in the effective bonding area is <3 particles per 100 cm², with zero particles larger than 25 μm.
Ultrasonic cleaning is more friendly to glass and metal parts, commonly 40 to 80 kHz for 3 to 8 minutes, using DI water and mild alkaline detergents to remove micro-particles and polishing residues;
For assemblies with polarizers or PSA frame tapes, use caution—water ingress can introduce later fogging risks.
CO₂ snow cleaning is a dry method that can blow off fine particles and some organics, suitable as the final step before bonding, but still insufficient for heavy oils.
Its advantage is avoiding introduced moisture; with good static control, recontamination is lower.
If you want better wetting, use “activation” methods
Low-pressure plasma in a vacuum chamber offers high stability, commonly 100 to 500 W for 30 to 180 seconds, usable for glass, PET, PC, and PMMA;
The downside is slower takt time, limited by loading/unloading and pumping. Atmospheric plasma uses nozzle scanning, with line speeds up to 50 to 200 mm/s, better for mass production;
But nozzle height, angle, and scan overlap introduce variability, demanding higher fixture consistency.
UV ozone is a gentler approach, commonly at 185 nm and 254 nm; 2 to 10 minutes can decompose organics and increase surface energy, suitable for films and coated parts sensitive to heat or ion bombardment;
The drawback is shallow treatment depth; it’s less effective against thick oils or strongly hydrophobic coatings.
Corona treatment is common for roll-to-roll films; typical power density is 0.5 to 2.0 kW/m², line speed 20 to 100 m/min, raising surface energy from ~32 mN/m to above 40 mN/m;
It’s not convenient for 3D parts or local areas, and edge-field non-uniformity can create a gradient in treatment distribution.
How long does the effect last?
A common phenomenon: immediately after treatment, water contact angle may reach 35 to 50°; after 24 hours it rebounds to 60 to 75°; after 72 hours it may approach 80°.
Glass rebounds more slowly, but can still degrade due to adsorption of airborne organics.
On-site practice is to define a hard KPI for the “treatment-to-bonding” interval: plastic parts should ideally enter bonding within 30 minutes;
Glass parts, under clean sealed packaging, can be held 4 to 8 hours, but verify with contact angle or dyne-value sampling.
Be careful not to damage coatings and polarizers
If atmospheric plasma is too close to the nozzle, local heating and ion bombardment can make anti-fingerprint coatings’ contact angle increase rather than decrease;
appearance issues like haze or more obvious rainbow patterns may appear.
UV ozone is generally more friendly to most inorganic AR stacks; the risk is that some organic coatings can be oxidized, changing friction coefficient.
Solvent wiping also risks damaging anti-fingerprint coatings; ketones or strong solvents can swell coatings.
It’s recommended to constrain usable solvents to one or two via a compatibility list, and define wipe pressure and number of passes in the work instruction.
If you want stronger bonding, add “chemical assistance”
Primers or adhesion promoters are often used on low-surface-energy materials—typical scenarios include PC, PMMA, and some coated surfaces.
The advantage is significant bond-strength improvement: 180° peel strength commonly increases from 3–6 N/25 mm to 10–18 N/25 mm, with better retention after damp-heat aging;
The trade-off is an added coating/drying step, and added thickness/uniformity management.
Silane coupling agents are more common on glass and oxide surfaces, forming Si–O bonds to link inorganic surfaces with organic adhesive systems.
Process-wise, control concentration and hydrolysis conditions; typical concentration is 0.5% to 2%.
Baking at 80 to 110°C for 10 to 30 minutes after coating improves film stability;
Too high humidity can cause non-uniform polymerized layers, making the surface more prone to fogging.
This route should be evaluated not only for initial strength, but also whether peel strength after 85°C/85%RH for 500 hours can still maintain above 70% of the initial value.
If you want to rely on “mechanical interlocking”
Sandblasting or micro-etching can raise Ra to 50 to 200 nm, increasing bonding area and interlock points, improving shear strength;
The problem is that optical parts are highly sensitive to haze. After roughness increases, haze may rise from 0.3% to above 1%, impacting display contrast.
Chemical etching on glass can create more uniform microstructures, but also increases scattering.
For high-transmittance optical bonding, roughening is generally limited to the bezel blackout area or structural bonding zones, avoiding the active display area.
In mass production, variability is the biggest fear
Low-pressure plasma is stable but slow; typical cycle time including chamber load/unload and vacuum pumping is often 60 to 180 seconds per part;
Atmospheric plasma can compress treatment to 5 to 20 seconds, but nozzle wear and gas-flow drift introduce intra-day variation.
Keep nozzle-to-part distance within 3 to 10 mm and use closed-loop monitoring of power and flow.
UV ozone cycle time is minutes, suitable for parallel multi-piece processing.
Maintenance focuses on lamp decay; reduced irradiance lowers contact-angle improvement.
It’s recommended to periodically calibrate with a radiometer and set replacement thresholds.
Corona has high throughput for webs; maintenance focuses on electrode cleanliness and discharge uniformity.
Carbon buildup narrows the treated width and creates left-right dyne-value differences.
Wide Temperature
Standard consumer-grade displays typically operate normally only in the 0°C to 50°C range, while industrial wide-temperature TFT LCDs must cover -30°C to 85°C or even a wider range.
The technical difficulty lies in changes to physical properties: at low temperatures, liquid-crystal viscosity increases exponentially, and response time may extend from 25 ms at room temperature to over 250 ms, causing severe motion smear/ghosting;
When high temperature exceeds 75°C, ordinary liquid crystal can reach the “Clearing Point” and enter an isotropic state, causing the screen to go black or the contrast to drop sharply.
A reliable wide-temperature module must use NI (Negative-Isotropic) wide-temperature liquid crystal, reinforced polarizers, and high-temperature-resistant OCA adhesive, and must pass more than 500 hours of thermal shock testing to ensure that under extreme temperature changes there are no bubbles, no delamination, and the backlight circuitry remains stable.
Working vs. Storage Temperature Difference
First, split it into two types
“Operating temperature” and “storage temperature” refer to two different things:
- Operating temperature: After power-on, the module can stably light up, refresh, and keep touch/interface links from dropping; image metrics remain within specified thresholds. Common industrial TFT ranges are -20 to 70, -30 to 80, and -40 to 85.
- Storage temperature: With power off, it won’t be damaged, and after returning to room temperature there is no permanent impact on function. Many modules specify ranges like -40 to 90 or -40 to 95, but that does not mean the display can operate at those temperatures.
Where do the numbers come from
A common approach is to place the module in a temperature chamber, soak for 30 to 120 minutes to let internal temperatures stabilize, then perform checks such as power-on display, full white/full black, grayscale, chromaticity coordinates, and interface read/write. Different suppliers use different pass/fail criteria:
- Some only require “it can display and has no permanent damage.”
- Some specify thresholds such as minimum contrast, brightness shift, chromaticity drift, and image persistence recovery time.
When selecting a module, ask clearly how “pass” is defined; otherwise, even if both claim -30 to 80, the real-world experience can differ greatly.
How to measure temperature
The easiest pitfall on-site is measuring at the wrong location. It’s recommended to view temperature in three layers:
- Ambient temperature: air temperature outside the cabinet / inside the vehicle cabin.
- Module temperature: thermocouple temperature attached to the LCD glass edge or the metal backplate.
- Component temperature: local hotspots near the backlight LED junction temperature and around the driver IC.
Many problems occur in (2) and (3): even with an ambient temperature of 45°C, when backlight power is 3 to 8 W and airflow is poor in a sealed cavity, a backplate temperature rise of 10 to 25°C is common; with direct sunlight plus heat absorption by a dark bezel/panel, local temperatures can be even higher.
It gets hotter inside an enclosure
The temperature inside a chassis/instrument panel is not a simple linear addition; it mainly depends on the heat dissipation path: backlight heat flows from the LED board to the aluminum backplate, then to the housing or heatsink. Users can quickly estimate risk with a few quantitative indicators:
- With backlight current maxed out, brightness improvement is limited, but power increases significantly, driving junction temperature up. Many designs implement brightness derating at high temperatures—for example, gradually current-limiting once the backplate exceeds 75°C.
- Fan stoppage or a clogged filter can make internal temperature 15 to 30°C higher than outside; in an outdoor sealed box under sun on a windless day, internal air reaching 70°C or higher is not rare.
What storage temperature is really about
Storage temperature is more like a materials reliability checklist: the focus is not whether the liquid crystal can respond, but whether materials undergo irreversible changes at high/low temperatures:
- Polarizers and adhesive layers: high temperature accelerates yellowing, shrinkage, and edge lift; OCA/OCR used for bonding can experience stress changes after long exposure to high temperature, and after returning to room temperature this may show up as edge whitening or localized bubbles.
- Backlight and plastic parts: light guide plates and diffuser films may deform at high temperature; at low temperature plastics become less tough, making cracks more likely during handling impacts.
- FPC and connectors: after thermal cycling, contact resistance increases and solder joint micro-cracking risk rises, especially with long flex cables and thin connectors.
What happens if you exceed the limits
If you exceed operating temperature but not storage temperature, the common outcome is “temporarily doesn’t work well”:
- Low temperature: response slows, grayscale smear becomes more obvious, refresh looks “sticky”; some modules specify that at -30°C, response time is allowed to increase to several times the room-temperature value.
- High temperature: contrast drops, color shift becomes more obvious, black level lifts; touch controllers and interface electrical margins shrink, so occasional artifacts, frame drops, or link drops are more common.
Transportation must be accounted for
Users often overlook shipping and warehousing: aircraft cargo holds, truck containers, and port yards have temperature conditions different from the usage environment. It is recommended to write logistics conditions into procurement terms:
- Storage temperature lower/upper limits, and allowed duration (e.g., is high-temperature exposure allowed for 48 hours or 240 hours?)
- Packaging format (moisture barrier bag, desiccant quantity, vacuum sealing or not)
- Whether a temperature indicator label or data logger is required
Condensation must be managed
Wide-temperature use often comes together with condensation: when equipment is moved from a cold environment to a warmer, humid one, glass and metal warm up slowly, and surfaces can easily dew up. Condensation is not reflected in a “temperature range,” but its impact on reliability is very real:
- Condensation exposes the FPC, backlight solder joints, and connectors to short-term high humidity; repeated events increase failure rates.
- Typical approaches include: sealing the enclosure, selecting a breathable membrane, using a heater for pre-warm, adding a power-on delay, or implementing a “only light up after temperature is ready” strategy in software. If there are frequent hot/cold transitions on-site, it’s recommended to write “whether condensation is allowed and how to prevent it” into system design requirements, rather than focusing only on LCD parameters.
Low-Temperature Response Slows Down
Where exactly does it get slow when it’s cold?
“Slow response” at low temperature is often more than one phenomenon:
- Startup drags: the time from power-on to functional readiness increases, commonly during power-rail ramp-up, peripheral self-check, and communication handshakes.
- Actions get sluggish: parts like motors, valves, pumps, and relays that must overcome friction and inertia show more obvious start delays.
- Readings can’t keep up: sensors take longer to settle from change to stability; control-loop phase margin is compressed, creating a feeling of not catching up to the target. Sensor response is often described by a “time constant,” i.e., the time needed to reach 63.2% of a step change.
- Display smearing becomes heavier: reduced liquid-crystal molecular mobility slows transitions, making motion blur and image persistence more visible; in severe cold it may even fail to light or visibility may degrade.
When the battery gets cold, the power supply becomes tight first
Using a common cylindrical Li-ion cell as a reference, one model defines 2900 mAh as 100% when discharged at 10 A constant current to 2.5 V cutoff at 23°C; as temperature drops, the deliverable capacity ratio decreases significantly:
- -20°C: 60%
- -10°C: 75%
- 0°C: 80%
- 60°C: 95%
Converted to capacity it’s more intuitive: at 23°C about 2900 mAh; at -20°C about 1740 mAh; at -10°C about 2175 mAh; at 0°C about 2320 mAh. Capacity loss is usually accompanied by lower available output power and larger voltage sag; when peak current hits, the system more easily reaches undervoltage thresholds, leading to retries, throttling, watchdog resets, and communication timeouts—issues that can look like “slowness.” During temperature transition testing, also pay attention to thermal equilibrium: some cell specs state that when charge/discharge temperature differs, you should allow about a 3-hour window for temperature change, to avoid “half-warm half-cold” data. Charging also becomes more sensitive: some specs advise reducing charge C-rate at low temperature to avoid increasing electrochemical side reactions.
The electrolyte thickens, ions move slower
At low temperature, multiple “slowdowns” stack in the electrochemical chain: electrolyte viscosity rises, lithium-salt solubility drops, increasing the risk of crystallization or localized solidification; interfacial byproducts make charge-transfer kinetics more difficult, and lithium dendrites may be induced, bringing safety risks. These changes increase equivalent internal resistance, showing up as larger terminal voltage drop at the same current and a shorter usable voltage plateau. The impact is especially obvious in scenarios requiring high-current pulses—slowness is often not due to insufficient compute, but unstable power forcing actions to complete “in segments.”
Chemical reactions are inherently afraid of cold
For many processes involving chemical reactions or diffusion, every 10°C decrease can reduce rate by about an “order of halving” (the exact factor depends on activation energy). In real systems, adhesive curing, coating leveling, adsorption/desorption in some gas-sensitive materials, and even dielectric polarization relaxation in capacitors can all lengthen “time-to-settle.” A quantity you can close-loop with one sample at room temperature may require a longer integration window or stronger filtering at low temperature, which appears as sluggish response.
Why does the screen smear more?
Some industrial TFT panels provide a response-time baseline at 25°C. Using an 8.4-inch panel spec as reference: at 25°C, typical rise is 20 ms, typical fall is 10 ms, total typical 30 ms (max up to 50 ms). At low temperature, increased viscous resistance slows molecular reorientation, lengthening response time; contrast also drops, and in severe cases it may not operate, though most recover after returning to the specified temperature range.
Mechanical parts get tight as soon as it’s cold
One silicone material is about 80 mPa·s at 25°C and rises to about 550 mPa·s at -25°C; another rises from about 1180 mPa·s to about 3730 mPa·s. Higher viscosity leads to:
- Motor startup requiring higher starting torque, increasing driver current spikes and worsening supply voltage sag
- Worse boundary lubrication on valve spools, gears, and rails; higher static-friction proportion, making the initial “breakaway” slower
- Elastomer seals hardening and rebounding more slowly, causing return delays or more leakage-compensation actions
How to capture “slow” properly in testing
- Record temperature stratification: ambient temperature, housing temperature, and key component temperatures (cell surface, near driver MOSFETs, near display glass). Drawing conclusions before thermal balance will make data drift. Cell temperature transitions can reference a ~3-hour practice.
- Connect the whole power path: capture battery terminal voltage, main rail voltages, and peak current.
- Write sensor response in time constants in the report: define response by the 63.2% step time; methods can follow common industry hot-liquid insertion tests to compare batch differences more robustly.
- List peripheral timeouts separately: at low temperature, SPI reads/writes, UART handshakes, wireless network join, and storage writes can fail more and retry more; “slow” often accumulates from retries.
- Don’t judge the display only by frame rate: record grayscale transitions and subjective smear ratings, and annotate the panel’s room-temperature response baseline (e.g., typical 30 ms) to judge whether low-temperature behavior is out of bounds.
High-Temperature Black Screen Risk
First clarify which kind of “black” you’re seeing
Even if it’s called a black screen, root causes can be very different, and the troubleshooting order will change:
- The backlight is off, but the image is actually still there: edge-lit or direct-lit backlights may dim heavily because driver derating or over-temperature protection reduces current; it looks like a black screen, but you can still faintly see the image outline with strong oblique light. Thermal derating and thermal shutdown are common for LED drivers: temperature rises first cause current limiting, and continued rise causes shutdown.
- The backlight is on, but it looks like a black film: at high temperature the LC layer’s light modulation weakens, causing contrast collapse, color shift, flicker; in severe cases the whole screen darkens or blacks out. Descriptions of black screen/black spots beyond rated operating temperature are common in industry materials.
- After a reboot the system stays black and doesn’t come back: the MCU, PMIC, or LDO entered over-temperature protection; display initialization didn’t complete or power rails were cut. It lights again after temperature drops half a minute later—this is a typical “thermal protection triggered then recovered” pattern. Thermal shutdown is self-protection for the chip, and datasheets usually emphasize it is not meant to protect the entire system from heating.
- Fixed black spots appear and don’t fade after cooling: more likely material layer thermal damage, such as localized “solar clearing” defects from concentrated sunlight, or polarizer/adhesive issues; the probability of irreversibility is higher.
As temperature rises, the liquid crystal starts to “stop obeying” first
As temperature approaches this range, contrast can change dramatically: LC material transitions from liquid-crystal phase to ordinary liquid phase, losing light-modulation capability. In experience, common trajectories include:
- Contrast becomes flatter and flatter: black level rises, dark regions turn gray, and eventually it looks like the whole screen goes black or gray.
- Flicker becomes more obvious: drive waveforms and LC threshold voltages drift with temperature, making pixel transmittance unstable. Temperature-compensated drive voltage is a repeatedly emphasized point by panel makers and IC vendors.
- The hotter it gets, the more “muddy” it looks: chromaticity drifts, grayscale order becomes chaotic; combined with weaker backlight, it can be misjudged as a system freeze.
The backlight is generating heat—and also “baking itself into lower brightness”
In many devices, the screen’s heat source is the backlight. Industry materials often list the backlight as a common internal heat source: as backlight current and power rise, panel temperature rises, eventually pushing into the blackout/black-spot risk zone. In one TFT module spec, the backlight uses a series/parallel combination of 14 LEDs, around 21.7 V and 40 mA—i.e., a continuously powered and continuously heating component. LEDs themselves lose luminous flux and shift color point at high junction temperatures; many LED binning processes measure at thermal steady-state 85°C precisely because temperature strongly affects output. Engineering notes also remind that datasheets often specify output at 25°C, but real operating junction temperature is higher, so brightness will be lower than the datasheet value. Add driver-side thermal derating and brightness decline can occur even earlier: when temperature rises beyond a threshold, the driver first limits current; continued rise triggers thermal shutdown, and the backlight becomes nearly off instantly.
Power and chips “save themselves” first, and the screen goes black as a consequence
High-temperature black screens are often not panel failure, but the power chain cutting off display-related voltages. Common paths:
- LDO or DC-DC thermal shutdown: overheated regulators shut down output, then recover when temperature drops—this is chip self-protection.
- Main controller junction-temperature limit: semiconductor safe junction-temperature limits are often around 150°C, with some up to 175°C; exceeding this brings reliability and characteristic-drift risks.
- Actual thresholds vary widely: even within the same device class, thermal shutdown and recovery points can differ by tens of degrees. Some device materials discuss examples where thermal shutdown occurs near 175°C and recovery near 155°C, showing a clear hysteresis—after triggering it won’t jitter repeatedly at the edge.
Polarizers and adhesive layers also fear heat—problems often start from the edges
Irreversible high-temperature blackout risk often starts from the “outermost layers” of the display:
- Polarizer bubbling and delamination: there are case descriptions in the display industry attributing polarizer peeling to “excessive heating”; delamination causes local transmittance anomalies, producing dark areas, bright spots, or rainbow patterns, and as it spreads it can look like black spots.
- Polarizer discoloration: high temperature, high humidity, or UV can yellow polarizers and shift color; many reliability tests first show edge color shift, then expand inward.
- Localized heating from sunlight: outdoors or under strong direct light, local temperature can be far higher than ambient, easily causing localized black spots that do not recover. Materials often list “solar clearing” black spots as a high-temperature risk.
Don’t ignore sun exposure—front glass can pull the temperature down a lot
In engineering recommendations about “LCD blackout,” there is a very practical data point: an in-line polarizer or shade film can reduce incident sunlight on the LCD by nearly 60%, lowering LCD temperature by about 24°C, while brightness loss is about 10%. The engineering implication is clear:
- Reduce “front-side heat absorption” first, then talk about rear-side heat dissipation.
- If a front cover glass is tightly thermally coupled to the panel, once the cover glass is heated by the sun it will conduct heat into the panel; insulation and ventilation must be designed together.
If you want to quantify risk, don’t measure only ambient temperature
A more robust approach is to separately record “ambient temperature, screen surface temperature, backlight strip temperature, and temperature near the driver IC,” then align the blackout time point with power logs and temperature curves. Some research on passive cooling experiments for OLED runs devices to steady state in a constant-temperature environment, then uses thermocouples and thermal imaging to record screen temperature distribution; the same approach applies to troubleshooting LCD/backlight hotspots. In practice, commonly used quantitative indicators can be recorded like this:
- Blackout trigger temperature: based on the hottest point on the screen surface, while also recording ambient temperature
- Brightness attenuation ratio before blackout: same white field, same camera exposure, compare brightness changes to distinguish “backlight weakened” vs. “LC contrast collapsed”
- Reproduction conditions: backlight brightness level, static image duty, whether bonded to a front cover, whether sunlight simulation is applied
- Recovery conditions: at what temperature it recovers, whether a reboot is required, and whether black spots or color shift remain after recovery
Long Life
In 24/7 continuous operation mode, the time for backlight LED brightness to decay to 50% of its initial value typically needs to reach 50,000 to 70,000 hours, far higher than the 15,000-hour standard for consumer-grade panels.
To achieve this target, the LED junction temperature must be strictly controlled to below 80°C, combined with polarizer materials resistant to high temperature and high humidity, and a driver-circuit design with MTBF exceeding 100,000 hours.
Backlight Lumen Maintenance Standards
Lifetime definitions
- L90 / L80 / L70 / L50: the cumulative hours until brightness drops to 90%, 80%, 70%, and 50% of the initial value, respectively.
-
End-of-Life definition in industrial purchasing commonly has two forms:
- Readability threshold: it is considered end-of-life once brightness falls below the minimum readable value on site.
- Specification-based: it is considered end-of-life once L70 or L50 is reached (easier for maintenance planning).
L50 / L70 wording
You will see different notations in different suppliers’ materials; first align the definitions:
| Notation | What it means | Common risk point |
|---|---|---|
| L70 50,000h | Hours until brightness reaches 70% | No temperature and current stated; insufficient information |
| L50 70,000h | Hours until brightness reaches 50% | L50 looks “better,” but the field may not tolerate 50% |
| “LED Life 50k” | Refers only to the LED package or light bar | Does not cover light guide, films, interconnects, and the power/control board |
| “Typical” | Typical value | Lot variation and poor thermal design can cause significant deviation |
How is lifetime tested?
You can cross-check against the checklist below:
- How measurement points are taken
- Brightness is measured with a photometer or imaging luminance meter, at the center point or a 9-point matrix.
- Brightness readings must specify: full-white image, fixed gray level, and whether auto-brightness is disabled.
- Measurement frequency
- Commonly recorded every 250 h or 500 h.
- Some perform 24 h to 72 h of stabilized burn-in first, then treat that moment as the “initial brightness.”
- Sample size
- Industrial use commonly has n=5 to n=20.
- If only a single-sample curve is provided, it is hard to judge lot-to-lot variation.
- Pass/fail methodology
- Use a lumen-maintenance curve to provide the hours to L70 or L50.
- Some include the source of the prediction method, e.g., LM-80 data and TM-21 extrapolation (used for LED package-level lifetime estimation), then combine it with measured temperature rise of the backlight structure to convert using the backlight-board temperature.
Temperature impact
Backlight decay is strongly related to temperature, for very straightforward reasons: LED efficiency drops, material aging accelerates, and optical films and polarizers are more likely to discolor or haze.
On site, you need to watch three temperatures rather than only “ambient temperature Ta”:
- Ta: ambient air temperature around the equipment
- Ts: temperature at the measurement point on the LED light bar or backlight board (board temperature)
- Tj: LED junction temperature (usually not measured directly, estimated via a model)
If a spec sheet says “L70 50,000h at Ta 25°C,” when applied in a North American cabinet with Ta 45°C and backlight board temperature 75°C, the lifetime in hours will shorten significantly.
A more useful industrial-project way of specifying it is: provide lifetime at board temperature Ts, or provide a mapping table between Ts and lifetime.
An actionable approach: ask the supplier to provide binned data of backlight board temperature versus lifetime—for example, the L70 hours corresponding to Ts 55°C, 65°C, and 75°C.
Current impact
The higher the backlight brightness, the larger the LED current is often, and the faster the decay.
When looking at lifetime, you must check current and brightness together, otherwise you can be misled by a “high-brightness version.”
Two common configuration approaches:
- Same brightness, lower current: increase the number of LEDs to reduce current per LED, lowering heat generation.
- Same structure, higher brightness: increase current; initial brightness looks good, but decay will be faster.
Many outdoor displays are rated at 1500 cd/m2 and look great only at shipment; if run at 100% for long periods on site, dropping below 1000 after two to three years is not uncommon.
A more robust plan is to leave headroom initially—for example, ship at 1200 to 1500 cd/m2, but in the field use an average of 800 to 1000 in daytime and lower at night; the decay curve will look much more comfortable.
Brightness thresholds
When defining thresholds, you can assign numbers by use scenario:
- Indoor HMI: typically 300 to 500 cd/m2 is sufficient.
- Semi-outdoor equipment: typically 600 to 1000 cd/m2.
- Strong-light environments: typically 1000 to 1500 cd/m2, and more dependent on anti-reflection and optical bonding.
The method to tie thresholds to lifetime is simple:
First define the minimum readable brightness—for example, outdoors it must not be lower than 800 cd/m2.
Assume you have L70 50,000h; then at 50,000h brightness is about 70% of the initial.
To still have 800 at that time, the initial should be about 1150 or higher.
Then factor in temperature rise and lot variation, and setting the initial to 1200 to 1400 will be more robust.
How does color change?
Common field observations are yellowish or greenish shifts, possibly due to LED phosphor aging and transmittance changes in the light guide plate and films.
You can require the supplier to provide color-drift specifications, for example:
- Chromaticity coordinate change (x,y) or u'v' change
- White-point CCT drift range, e.g., from 6500K drifting to 7500K
- MacAdam ellipse steps
Thermal Control and Heat Dissipation Design
First, state the temperature targets clearly
Define three temperature red lines first: the maximum chip junction temperature, the maximum touch-safe enclosure surface temperature, and the assumed inlet ambient temperature.
A common practice is to design to an ambient temperature of 35°C or 40°C, and then leave 20°C to 30°C of safety margin for the chip.
If ambient is 40°C and the allowed chip junction temperature is 95°C, then the entire thermal chain is allowed only a 55°C temperature rise.
Allocate the 55°C rise across power dissipation, and you can back-calculate what thermal resistance range the heatsink, interface materials, and airflow path must each achieve.
It is recommended to model power in two bands: steady-state power and peak power.
Where does the heat come from?
Break heat sources into a component-level list: main processor, RF, memory, power-supply modules, backlight, or motor-type loads.
For each device, provide three sets of data: typical power, peak power, and duty cycle.
For power-supply modules, additionally provide an efficiency curve.
The loss difference between 90% and 95% efficiency at 10 W output is 0.56 W; that heat lands on a small copper area, and local temperature rise can be more severe than the main processor.
For high-transient loads, clarify the time scale: 100 ms-class peaks are mostly absorbed by package and heatsink thermal mass, while 10 s-class peaks will noticeably raise enclosure temperature.
Where does the heat go?
Write the thermal path clearly by layers: chip to package lid, lid to thermal interface medium, thermal interface to vapor chamber or heatsink, heatsink to air, then to the chassis and outside environment.
For each segment, specify the target thermal resistance range and the rationale for material selection.
The thermal interface layer is often where designs fail most easily: a 0.2 mm grease layer with an effective thermal conductivity of 3 W/mK has an areal thermal resistance of about 0.067 K·cm2/W;
At 0.5 mm thickness it becomes 0.167 K·cm2/W, and temperature rise increases noticeably.
Assembly flatness and clamping force also widen contact thermal resistance; in mass production it is common for the same design to show a temperature spread of 8°C to 12°C, so assembly tolerances must be included in the thermal-path model.
How to choose thermal grease, pads, and phase-change materials
Thermal grease commonly has 3 to 8 W/mK conductivity; its advantage is low contact thermal resistance, but after long-term thermal cycling it may pump out, especially more noticeably in vibration environments.
Thermal pads commonly have 2 to 6 W/mK; their advantage is higher assembly tolerance and the ability to accommodate height differences above 0.3 mm, but the thermal-resistance penalty from thickness must be explicitly budgeted.
Phase-change materials soften around 55°C to 65°C; initial assembly contact resistance is close to grease, while being more resistant to pump-out than grease, making them suitable for equipment needing over three years of stability, but they require higher surface cleanliness.
How to size the heatsink
Under natural convection, the surface heat-transfer coefficient is commonly 3 to 8 W/m2K;
With airflow, it can reach 20 to 80 W/m2K, depending on air speed and fin spacing.
Assume you need to dissipate 15 W of heat and allow the heatsink surface to be 25°C above ambient.
Under forced-air conditions, take a heat-transfer coefficient of 40 W/m2K.
The required effective heat-transfer area is about 0.015 m2, i.e., an unfolded area on the order of 150 cm2.
Fin spacing that is too dense will choke airflow; common manufacturable spacing is 1.0 mm to 2.5 mm, depending on dust level and fan static pressure.
In terms of materials, aluminum alloys have thermal conductivity of about 150 to 200 W/mK, while copper is about 380 to 400 W/mK.
Do you need heat pipes or a vapor chamber?
If the distance from the heat source to the main heat-exchange region of the heatsink exceeds 30 mm to 50 mm, a plain copper plate will show a significant temperature gradient, and hotspots can easily hit the junction-temperature limit.
For heat pipes, clearly state orientation constraints and maximum heat-transfer capacity; too small a bending radius will affect capillary return flow.
For vapor chambers, pay attention to startup temperature differential and internal cavity thickness; thin structures under high heat flux depend more on good interface contact.
How to arrange the fan and airflow path
Small fans differ greatly in static pressure at the same airflow. Insufficient static pressure can cause actual airflow to drop to half of the rated value.
Noise should be described in A-weighted decibels, and the test distance and installation condition must be stated; a bare fan rated 28 dBA may become 35 dBA or higher once installed in a housing.
The airflow path should clearly specify inlet area, filtration plan, exhaust path, and recirculation risk.
When the effective open-area ratio of the inlet is below 40%, pressure loss rises significantly; increased fan power consumption will in turn heat the interior.
For dusty environments, reserve margin in the curve of filter pressure drop increasing with clogging; otherwise after three months the airflow decay can raise junction temperature by about 10°C.
How should the fan run to be “proper”?
Sensed temperature can fuse an estimated chip junction temperature with a board NTC calibrated value to avoid single-point drift.
The control loop is recommended to include hysteresis and slew-rate limiting, to avoid frequent gear changes caused by temperature dithering near thresholds.
The fan curve should specify concrete thresholds and RPM: for example, below 55°C no more than 2000 rpm; from 55°C to 75°C increase 120 rpm for every 1°C rise; above 75°C ramp to 4500 rpm and allow short-term overshoot.
How to measure temperature reliably
Board NTC placement should avoid heating copper pours and high-current traces. Too close to a heat source will overestimate temperature, while too far will lag.
For enclosure temperature, attach a thermocouple at locations users may touch for long periods and fix the clamping force; poor contact can cause 2°C to 5°C error.
Sensor accuracy must be stated in documentation: common NTCs can achieve 1% resistance tolerance at 25°C, but error enlarges at 80°C, so two-point or three-point calibration is required.
For internal chip temperature readings, specify whether it is an estimate or physical junction temperature. Many chips provide a thermal diode or model-estimated value; sampling period and filtering also affect control response.
Weiterlesen
Under strong outdoor light, you should choose an IPS panel with brightness above 800 nits and a 178° viewing angle. For low-speed display use SPI; for high-definition video streams you must use a M...
IPS panels, with their 178° wide viewing angle and 99% sRGB color gamut, far surpass ordinary TFT (TN) panels in color accuracy, making them suitable for image processing; Although their response t...
Hinterlasse einen Kommentar
Diese Website ist durch hCaptcha geschützt und es gelten die allgemeinen Geschäftsbedingungen und Datenschutzbestimmungen von hCaptcha.