


Wearable Display Selection | Size, Power & Visibility
Selecting a wearable display requires a precise balance of size, power consumption, and visibility.
For smartwatches or AR glasses, core sizes mostly range between 0.39 and 1.4 inches.
To ensure battery life, system power consumption should be kept below 100mW;
In terms of visibility, outdoor display brightness must break through 1000 nits, or utilize Micro-OLED technology with a contrast ratio as high as 100,000:1.
Size
Wrist-worn device cases are usually between 38 mm and 49 mm, with an effective display area of approximately 700 to 1150 square millimeters.
Micro-displays, such as AR modules, often have physical diagonals of 0.2 to 0.5 inches.
Adult wrist circumferences range from 140 to 210 mm, requiring the screen width to be controlled within 35 mm.
Wearing Space Limits
Global ergonomics surveys show that in 2023 statistics for 1,500 respondents, the median adult wrist circumference was 165 to 180 mm.
The anatomical features of the wrist bone structure limit the contact area of the case bottom; usually, the flat area on the back of an adult's wrist is only 45 to 55 mm.
If the lug-to-lug distance of the case exceeds this value, the edges of the device will hang in the air, resulting in decreased wearing stability and a sensation of physical shaking.
| Wrist Range (mm) | Suggested Max Length (mm) | Coverage Statistics (%) | Typical Audience Region |
|---|---|---|---|
| 140 - 155 | 40 - 42 | 12 | North American/Western European Female |
| 160 - 180 | 44 - 48 | 65 | Global Universal Standard |
| 185 - 210 | 50 - 52 | 18 | North American/Northern European Male |
| Above 210 | Above 54 | 5 | Athletes/Specific Groups |
An increase in physical shaking directly interferes with the signal acquisition of the Photoplethysmography (PPG) optical heart rate sensor, as ambient light enters through the bottom gap.
Research data indicates that when the case shifts laterally by more than 3 mm, the signal-to-noise ratio of blood oxygen saturation monitoring drops by 15% to 22%.
This spatial redundancy not only affects data accuracy but also generates centrifugal impact forces of up to 0.5 Newtons during arm swings.
The magnitude of the centrifugal impact force is closely related to the overall thickness of the device; the higher the center of gravity, the more obvious the friction of the inertial torque on the skin.
In 2024 wearable laboratory tests, the pressure on the wrist of a 14 mm thick device during jogging was 28% higher than that of a 10 mm thick device.
To maintain movement space within shirt cuffs, business-style wrist terminals typically lock the total thickness within a narrow range of 10.7 mm to 11.2 mm.
| Thickness Range (mm) | Scenario Suitability Evaluation | Sensor Integration Space | User Tactile Feedback |
|---|---|---|---|
| 8.5 - 10.0 | Ultimate comfort, suitable for sleep monitoring | Limited to basic single-layer circuits | Almost imperceptible wearing |
| 10.5 - 12.5 | Standard for most full-featured watches | Space for double-layer stacked structures | Medium weight sensation |
| 13.0 - 15.5 | Professional outdoor or diving equipment | Extra-large battery and ruggedized structure | Very strong presence |
| Above 16.0 | Industrial or specialized task terminals | Includes independent communication or cooling modules | Prone to impacts |
Since increased thickness often accompanies the stacking of display module levels, it creates a noticeable visual drop between the bezel and the display plane.
In a survey report involving 800 users, 74% of participants preferred designs where the cover glass is flush with the case edge.
This smooth transition reduces total internal reflection ghosting at the screen edges at viewing distances of 20 cm to 30 cm.
The elimination of total internal reflection ghosting relies on the bonding thickness between the display screen and the protective glass, which usually needs to be controlled within 0.15 mm.
The ultra-thin adhesive layer not only improves light transmittance but also compresses the vertical height of the entire display unit, freeing up about 8% of the volume for the battery compartment.
Space utilization is even more stringent in head-worn devices like AR glasses, as the bridge of the nose has an extremely low weight-bearing limit.
Pressure threshold tests on the nose bridge area indicate that during long-term wearing, the load on a single supporting point should not exceed 15 grams.
Optical solutions released in 2022 mostly adopt catadioptric optical paths, reducing the horizontal size of the imaging module to 12 mm by 10 mm.
This miniaturization of size allows the center of gravity of the eyeglass frame to shift backward, distributing the weight more evenly between the auricle and the bridge of the nose.
| Head Structure Parameter | Typical Range (mm) | Adjustment Range Requirement | Data Weight (%) |
|---|---|---|---|
| Interpupillary Distance (IPD) | 55 - 75 | Must support manual or electric adjustment | 45 |
| Temporal Width (Head side) | 135 - 160 | Temples must have 15-degree elastic opening | 30 |
| Ear Position Height | Relative to nose bridge 0 - 15 | Temple tilt angle must be adjustable | 15 |
| Eyelash Interval | 8 - 12 | Minimum distance to prevent lens contamination | 10 |
To prevent eyelashes from touching the lens during blinking, the optical eye relief must be maintained within the range of 10 mm to 15 mm.
Too short a distance will cause water vapor to condense on the lens surface; in an environment with 60% humidity, clarity will drop by more than 40% within 5 minutes.
Spatial layout optimization is not just for aesthetics, but to maintain relative stillness between the device and human body feature points during strenuous exercise.
Relative stillness between the device and the human body is the physical prerequisite for the precise operation of all sensors, especially for electrocardiogram (ECG) monitoring.
It requires the span of two contact electrodes on the wrist to reach at least 25 mm to capture sufficient millivolt-level voltage differences.
In experiments targeting 300 cardiovascular patients, for every 5 mm increase in electrode spacing, the identification success rate of the R-wave peak improved by 12%.
This fine division of centimeter-level space determines the arrangement logic of different functional modules within the restricted area.
In a typical 44 mm case, the antenna system usually occupies 15% of the edge circumference to ensure signal penetration through the metal frame.
Design trends for 2025 show that by sharing the middle frame as an antenna array, approximately 1.2 mm of extra space can be provided for bezel reduction.
Pixel Clarity Level
2024 wearable market statistics show that approximately 85% of mid-to-high-end wrist devices set the display density above 320 PPI.
At an average viewing distance of 25 cm, the human eye's resolution limit is about 60 pixels per degree, making 326 PPI the industry floor for retina-level display.
This physical distribution ensures that users do not perceive jagged edges on the strokes of small text in 8-point fonts.
The elimination of jaggedness relies on the tight arrangement of pixels, especially for rendering circular or curved dial edges.
A visual test targeting 500 North American respondents pointed out that when display density increased from 260 PPI to 400 PPI, eye fatigue during long-form reading decreased by 18%.
Higher pixel capacity allows UI designers to use thinner lines in extremely small spaces, thereby improving the detail presentation of map navigation or health charts.
The quality of detail presentation depends not only on the total number of pixels but is also constrained by specific screen sizes.
At the same resolution, for every 0.1-inch increase in physical screen size, the pixel density undergoes non-linear dilution.
| Screen Diagonal (inches) | Pixel Resolution (px) | Pixel Density (PPI) | Visual Effect Evaluation |
|---|---|---|---|
| 1.2 | 390 x 390 | 460 | Extremely fine, no graininess |
| 1.4 | 454 x 454 | 458 | Retina standard, suitable for high-density text |
| 1.6 | 400 x 400 | 354 | Good, daily sports data is clear |
| 1.9 | 410 x 502 | 338 | Standard, large-screen reading is comfortable |
Light transmission efficiency and driving current distribution within a unit area also differ across different display panels.
To maintain high clarity in small spaces around 1.5 inches, developers often use LTPO technology to optimize refresh rates.
Selection trends for 2025 indicate that more than 60% of flagship watch models will adopt dynamic refresh technology to reduce system power consumption when displaying static clear images.
The balance point for power consumption is often built on the choice of pixel arrangement, common ones including standard RGB arrays and sub-pixel sharing technologies.
A laboratory comparison of 400 mainstream wearable displays found that screens using RGB arrangement have an advantage over sub-pixel sharing solutions when displaying fine straight lines.
While sub-pixel sharing solutions can increase the aperture ratio, weak color fringing often occurs at the edges when displaying extremely small fonts or high-contrast text.
The intensity of color fringing is regulated by sub-pixel rendering algorithms, which require the processing chip to have stronger real-time computing performance.
Under the collaboration of high-performance processors and high-density screens, character edge recognition improved by 12% in 2023 comparative experiments.
This improvement ensures that users can still accurately read instantaneous heart rate data on the screen in strong light environments or when quickly swinging their arms.
- Contrast Performance: High pixel density screens usually pair with a 1,000,000:1 contrast ratio, giving text in dark mode a more suspended feel.
- Bezel Reduction: The gap between the display layer and the cover glass is reduced to within 0.2 mm, reducing refraction loss between layers and improving visual sharpness by 15%.
- Anti-aliasing Algorithms: Solving the flickering sensation in low-pixel modes through pixel-level dynamic smoothing at a 60 fps frequency.
- Coating Intervention: Anti-reflective coatings can block more than 90% of ambient background light noise, thereby virtually increasing the visual purity of pixels.
The maintenance of visual purity faces more severe data challenges in Augmented Reality (AR) glasses.
Since the AR screen is only about 2 cm from the human eye, the evaluation standard shifts from PPI to PPD (Pixels Per Degree).
A visual simulation targeting 200 pilots in 2024 showed that PPD must reach 60 to completely eliminate the "screen-door effect" and achieve clarity equivalent to natural vision.
| Display Parameter Category | Watch/Band Standard | AR/VR Glasses Standard | Key Difference Point |
|---|---|---|---|
| Core Metric | PPI (Pixels Per Inch) | PPD (Pixels Per Degree) | Different evaluation dimensions determined by viewing distance |
| Clarity Threshold | Above 326 PPI | Above 60 PPD | Difference in space occupancy and eye entry angle |
| Pixel Pitch | 0.05 - 0.08 mm | 0.003 - 0.01 mm | AR requires extremely high physical integration |
| Typical Resolution | 450 x 450 level | 2K x 2K level | Rendering load grows exponentially |
The surge in rendering load requires display driver chips and battery modules to complete heat dissipation and energy distribution within extremely small spaces.
For every 10-unit increase in PPD, the corresponding image processing data volume increases by approximately 25%.
To cope with this data pressure, a 2026 forecast report indicates that Silicon-based OLED technology will occupy 70% of the wearable high-precision micro-display market.
Silicon-based OLED can integrate pixels directly onto the driving circuit, achieving an amazing density of thousands of pixels per inch.
With this technical support, even a 0.3-inch display module can accommodate high-definition resolutions exceeding 1280 x 720.
This miniaturization trend not only reduces the overall volume of the optical system but also provides about 30% extra space for overlapping multi-lens groups, thereby further correcting edge distortion.
Edge distortion correction is the physical guarantee for image clarity under a wide field of view.
Laboratory test data shows that when the viewing angle shifts 20 degrees from the center, modules using aspheric correction can maintain 92% pixel accuracy.
This high accuracy performance allows wearable devices to evolve from simple notification viewers into professional terminals capable of carrying precise medical images or industrial modeling data.
Bezel Display Ratio
A 2024 global wearable display market analysis pointed out that the screen-to-body ratio of high-end models has increased from 65% five years ago to over 88%.
In a visual preference survey of 1,200 North American users, reducing the bezel width to below 1.5 mm can significantly reduce visual obstruction.
This extreme compression of physical size not only optimizes aesthetics but also allows for larger display panels to be integrated within case bodies of the same volume.
The non-display area between the Active Area of the display panel and the external aluminum or titanium frame is usually composed of a black matrix, circuit routing space, and a sealing adhesive layer.
Flexible OLED encapsulation technology released in 2023 successfully reduced the black border width at the bottom of the screen from 3.5 mm to 1.8 mm by bending the driver chip backward.
The reduction of bottom space is mainly attributed to the popularization of Chip-on-Plastic (COP) technology, which had a 22% higher adoption rate in 2024 compared to last year.
Compared to the traditional Chip-on-Film (COF) connection method, COP allows the display substrate to directly carry the driving components and achieve R-angle bending.
This arrangement eliminates the large "chin" space below the screen, making the visual center of gravity of a circular screen more centered within a 44 mm case.
Shifts in the visual center of gravity affect the user's perception of UI menu alignment, especially in circular dials, which are highly symmetrical geometric shapes.
Laboratory data show that when the asymmetry between the top and bottom bezels exceeds 0.3 mm, about 60% of respondents experience a noticeable visual imbalance.
To address the visual defects caused by asymmetry, routing density around the screen increased by about 30% in 2023 technical iterations.
This high-density routing requires higher-precision lithography equipment to arrange thousands of transparent conductive circuits within gaps of only a few microns.
Fine circuit layout provides the physical foundation for narrow bezel designs, pushing the side bezel width limit toward the 1.2 mm industrial design goal.
A 1.2 mm side bezel creates an illusion that the display content is floating above the case during wearing, enhancing the immersive experience during interaction.
In pressure tests targeting 800 prototype units, the drop damage rate of narrow-bezel modules from a height of 1.5 meters was about 12% higher than that of wide-bezel modules.
The increase in damage rate forces the structural buffer space between the case material and the display module to undergo millimeter-level precise fine-tuning.
Environmental reliability experimental samples from 2022 indicate that a sealing width of 1.8 mm is the safety floor for maintaining a 5ATM waterproof rating.
If the sealing adhesive layer is excessively reduced to pursue an extreme screen-to-body ratio, the probability of moisture penetrating internal circuits under high water pressure increases by more than 25%.
Compression of the sealing width must be paired with high-adhesion-strength UV-curable glues to ensure sufficient grip on extremely small contact areas.
The application of new adhesive materials in 2024 reduced the thickness of the sealing layer by 0.1 mm while maintaining the same chemical corrosion resistance as previous generations.
Stable chemical corrosion resistance protects the touch sensors at the screen edges, preventing sensitivity drift due to sweat infiltration.
In a full-screen touch interaction mode, the reduction in bezel ratio allows the effective touch area to extend by about 15% toward the edges.
This 15% incremental area accommodates more complex side-swipe back gestures, reducing the frequency of user accidental touches in narrow spaces.
A decrease in accidental touch frequency directly improves the operation efficiency of complex applications, especially in unstable dynamic scenarios like outdoor exercise.
2025 wearable device design guidelines suggest that the width of the non-inductive zone at the screen edge should be controlled within 0.8 mm to achieve seamless edge gesture triggering.
The accuracy of edge triggering is also affected by the arc of the cover glass edge; usually, 2.5D or 3D glass generates optical refraction.
Optical refraction causes pixels at the screen edge to exhibit about 5% brightness attenuation or color deviation at a 30-degree viewing angle.
To compensate for this refraction loss, high-end modules use independent brightness gain algorithms on edge pixels, keeping edge clarity consistent with the central area.
Pixel brightness uniformity is a key metric for measuring display module encapsulation levels, especially when displaying the white background of a system interface.
In 2023 mass production quality checks, the display uniformity of modules with screen-to-body ratios exceeding 90% reached a calibrated standard of 92%.
Maintaining display uniformity depends on current distribution in the backlight unit or OLED light-emitting layer, which places higher requirements on routing impedance within extremely narrow bezels.
As the screen-to-body ratio continues to increase, ambient light sensors and proximity sensors have had to move from the bezel area to below the display screen.
Technical solutions in 2024 show that the pixel light transmittance in the under-screen sensor area has increased to 40%, sufficient to support precise automatic brightness adjustment.
Under-screen integration released 3% to 5% of bezel space originally occupied by sensors, achieving a truly full-screen visual effect.
Market analysis predicts that by 2026, under-screen sensor technology will be used at scale in more than 45% of mid-to-high-end wearable devices.
This technical evolution path reflects users' continuous pursuit of a balance between a large-screen experience and a compact wearing volume.
Even if the physical size remains unchanged at 41 mm, by increasing the bezel ratio, the actual display area can still achieve a substantial growth of about 10%.
This increase in area makes it possible to display multiple health monitoring indicators on the same screen, allowing blood oxygen, heart rate, and respiratory rate to be read without frequent scrolling.
Power
Under 100,000 lux of direct sunlight, AMOLED screens need to reach a peak brightness of 800 to 1500 nits to maintain a basic contrast ratio of 5:1.
Through Full Lamination technology, extra reflections of 4% to 10% caused by the air layer can be eliminated.
Reflective MIP screens perform better in strong light; their approximately 15% reflectivity, coordinated with ambient light, provides clearer character boundaries than backlight displays.
For AR terminals, the optical waveguide loss rate is as high as over 90%; therefore, MicroLED source brightness needs to reach over 2,000,000 nits.
Brightness Output Standards
In standard indoor office environments, displays usually maintain around 300 nits, which just offsets the approximately 500 lux of natural ambient light in typical Western European or North American offices.
This brightness baseline fluctuates drastically when users move outdoors; especially in a 20,000 lux cloudy environment, the screen needs at least 600 nits to maintain a basic 10:1 contrast ratio.
A 2024 legibility study of 1,200 wearable device samples showed that when brightness increased from 600 nits to 1000 nits, user reading speed increased by an average of 25%.
Achieving brightness thresholds above 1000 nits mainly relies on High Brightness Mode (HBM), which breaks through conventional limits by significantly increasing the driving current of organic light-emitting materials for a short time.
On devices equipped with a 450 mAh battery, a peak brightness of 2000 nits can usually only be maintained for 60 seconds before hardware protection mechanisms force a frequency reduction due to the case temperature reaching 45 degrees Celsius.
This thermal management strategy is due to pixels experiencing a non-linear growth of about 30% in driving current demand after crossing the 600-nit threshold, leading to rapid power consumption accumulation.
Based on laboratory tests of 50 AMOLED panels of different specifications, maintaining 1500 nits of display brightness requires approximately 450 mW of instantaneous power.
Behind high power consumption is the need to overcome direct sunlight as high as 100,000 lux at noon in California or Southern Europe summers, where ambient light intensity is 200 times that of indoor environments.
Visibility under sunlight highly depends on Ambient Contrast Ratio (ACR); as long as the screen output brightness reaches 1% of the ambient lux value, ACR can remain at a usable level above 5:1.
When calculating ACR, the impact of surface reflections must be excluded; uncoated sapphire glass used in high-end sports watches typically has a 4% surface reflectivity, which significantly dilutes image density.
AR augmented reality glasses face even more severe physical limits; their MicroLED light sources must generate 4,000,000 nits of ultra-high brightness to offset the 99% light efficiency loss of optical waveguides.
Extremely high source brightness ensures that on lenses with 80% light transmittance, digital overlay information still has a residual brightness of 1500 nits entering the eye against a bright blue sky background.
Starting from 2023, the popularization of LTPO backplane technology has made brightness adjustment more delicate, supporting Pulse Width Modulation (PWM) dimming schemes with up to 4096 levels.
Fine-grained dimming solved the visual discomfort of approximately 15% of sensitive users caused by step-like brightness jumps when moving from a dark room into a brightly lit corridor.
Ambient light sensors (such as TCS3701) can provide 0.01 lux detection accuracy, supporting the system in completing parameter synchronization from extremely dark to high light within 100 milliseconds.
Rapid sensor response ensures that the moment a user raises their wrist, the screen has already precisely matched the 800-nit reading standard required for the current environment, reducing the pressure of repeated pupil adjustment.
Test data from 200 prototypes show that Anti-Reflective (AR) coatings can improve user perceived brightness by about 15% without increasing battery burden.
These coatings use the principle of destructive interference to cancel out environmental glare, allowing the DCI-P3 color gamut coverage of the display to maintain above 90% in strong light.
When brightness exceeds 1200 nits, due to non-linear degradation of light-emitting materials, color accuracy usually undergoes an offset of about 8 Delta-E units, requiring repair through driver-layer calibration.
Dedicated calibration files ensure that at extremely high brightness, deep red and fluorescent green in sports UI interfaces still maintain high recognition without losing visual details due to over-saturation.
Display driver chips after 2025 are fully shifting to 12-bit color depth, providing 68 billion colors to eliminate color banding common in 30% of older devices at peak brightness.
Smooth color gradients combined with OLED-specific circular polarizers can effectively block 99.9% of internal structural reflections, which is the foundation for achieving "pure black" under any light.
Pure black performance provides infinite contrast for 2-nit Always-On Display (AOD), making its power consumption in a nighttime bedroom environment only 5 mW while maintaining clear readability.
This span from milliwatt-level to thousand-nit-level constitutes the current industrial standard for wearable display selection.
| Brightness Level (nits) | Typical Application Scenario | Estimated Power (mW) | Battery Impact (Per hour) |
|---|---|---|---|
| 2 - 10 | Nighttime AOD mode | 5 - 15 | < 0.1% |
| 150 - 300 | Indoor office/home | 80 - 150 | 1% - 2% |
| 600 - 1000 | Outdoor cloudy/walking | 250 - 400 | 5% - 8% |
| 2000+ | Direct sunlight/Peak HDR | 600 - 900 | > 15% (Limited) |
The stability of brightness output is limited by the constant current source precision of the driver chip; in a 20-degree Celsius environment, the brightness uniformity error of top-tier panels can be controlled within 3%.
High uniformity prevents obvious yellowing or brightness decay at the screen edges when displaying large-area maps or white backgrounds, improving overall visual quality.
In the pursuit of ultimate visibility, the refractive index of the cover glass (typically 1.5 to 1.7) is the final physical barrier determining the final luminous flux entering the eye.
Structural Reflection Control
As light penetrates the cover glass and reaches the display pixels, Fresnel reflections occur at every interface between media with different refractive indices.
At the interface where the refractive index of air is 1.0 and ordinary aluminosilicate glass is 1.5, the reflectivity of a single surface is approximately 4.2%.
When light passes through the air layer of a traditional non-fully laminated structure, light jumps twice extra at the inner surface of the glass and the outer surface of the display, causing total reflectivity to soar to 12% to 15%.
This high proportion of reflected light masks the useful signals emitted by the display, forcing the backlight module to increase output power to maintain readability.
An optical pressure test conducted on 850 wearable device prototypes in 2022 showed that compressing the air gap from 0.3 mm to 0.05 mm improved contrast by 40% in strong light.
To completely eliminate visual interference caused by the air layer, full lamination technology fills this area with Optical Clear Adhesive (OCA) or Optical Clear Resin (OCR).
The market application rate of OCA adhesive film reached over 75% in 2023, with its refractive index usually set between 1.49 and 1.51.
This value highly matches the cover glass, so light undergoes almost no refractive angle shift when crossing the interface, maintaining light transmittance above 92%.
For sports watches with 3D curved edges, liquid OCR resin demonstrates better filling characteristics, eliminating about 5% of rainbow patterns generated at the edges.
The fluidity of this material ensures that no bubbles are generated under large-curvature cover plates and remains stable in thermal cycle experiments from -40 to 85 degrees Celsius.
While full lamination solves internal reflections, ambient light reflection on the outermost surface remains the primary variable interfering with vision.
High-end models reduce reflectivity to below 0.5% by depositing multi-layer Anti-Reflective (AR) coatings on the glass surface, utilizing the principle of destructive interference.
AR coatings are typically composed of alternating layers of high-refractive-index (such as Titanium Dioxide) and low-refractive-index (such as Magnesium Fluoride) materials, with as many as 7 to 11 layers.
In a 2024 durability sampling, after 5000 steel wool friction tests, high-quality coatings still maintained 98% of their initial anti-reflective efficacy.
After ambient light penetrates these nano-level coatings, even in the extreme light of 100,000 lux, the screen can still present a deep background color.
For self-emissive AMOLED screens, internal structural reflection control relies on a combination of circular polarizers and quarter-wave plates.
Ambient light enters through a linear polarizer and is then converted into circularly polarized light by the quarter-wave plate; its rotation direction changes after hitting the electrode layer and reflecting.
When it returns to the polarizer, due to a 180-degree phase rotation, approximately 99.7% of internal reflected light is intercepted inside the screen and cannot spill out.
This mechanism is the technical prerequisite for achieving the "screen-off aesthetics" of wearable devices, ensuring the screen color is highly consistent with the case in the off state.
Measurements of 300 different batches of polarizers in laboratories show that the higher the extinction ratio, the less likely the image saturation under sunlight is to suffer from washout.
With the popularization of sapphire glass in high-end outdoor watches, reflection control faces new physical limits because sapphire's refractive index is as high as 1.76.
The high refractive index leads to an inherent reflectivity of sapphire interfaces approaching 8%, nearly double that of ordinary reinforced glass.
Without the assistance of double-sided multi-layer AR coatings, sapphire dials will produce a noticeable mirror effect under direct light, reducing reading efficiency.
Research data show that adding Anti-Fingerprint (AF) coatings to untreated sapphire surfaces can guide oil distribution to reduce diffuse light reflection.
AF coatings change the surface energy state, keeping the water contact angle above 115 degrees, effectively blocking light scattering by fingerprint oils.
In 2025 display efficacy forecasts, Integrated Polarizer (Pol-less) technology is attempting to remove traditional polarizers to improve brightness by 20%.
This technology significantly reduces the physical thickness of display modules while maintaining low reflectivity by directly growing thin-film structures on color filters.
| Structural Solution | Surface Reflectivity Value | Transmittance Level | Outdoor Contrast (ACR) |
|---|---|---|---|
| Traditional Air Bonding | 12.5% | 88% | 2:1 (Poor) |
| Standard Full Lamination (OCA) | 4.3% | 93% | 5:1 (Good) |
| Sapphire + Single-sided AR | 4.1% | 91% | 6:1 (Excellent) |
| Glass + Multi-layer Double-sided AR | 0.8% | 98% | 15:1 (Great) |
This fine control from the percentage level to the decimal level directly determines whether users can read heart rate data at a glance during strenuous exercise.
In the pursuit of ultimate vision, the haze value of the cover surface is also a frequently quantified parameter, usually controlled between 1% and 3%.
Low haze ensures the sharpness of text edges, while fine surface textures effectively disperse glaring spots formed by direct light sources.
The ultimate goal of reflection control is to use physical optical means to replace high-energy-consumption brightness output within limited battery capacities.
Every 1% reduction in reflectivity is equivalent to saving approximately 50 mW of backlight driving power at a perceptual level, which is significant for extending standby time.
Contrast Index Analysis
Laboratory static contrast is obtained by measuring the brightness ratio between all-black pixels and all-white pixels; AMOLED panels can usually reach the theoretical limit of 1,000,000:1 in this dimension.
This data was confirmed in a 2024 sampling survey of 2,200 wearable display modules, where black level brightness was generally below 0.0005 nits.
Such extreme dark field performance ensures that in indoor environments with weak light, gray halos common in LCDs do not appear at the edges of watch face text.
In tests of high-contrast maintenance capability, the current control precision of the driver IC directly affects the linearity of grayscale.
Experiments show that at a low grayscale brightness of 5%, if the uniformity deviation of contrast exceeds 8%, users will perceive uneven screen coloring.
This visual deviation has been effectively suppressed in modern display chips using 10-bit color depth, which can provide 1024 levels of brightness step processing.
Ambient Contrast Ratio (ACR) is the real indicator for measuring the readability of wearable devices in actual outdoor scenarios.
When ambient light intensity reaches 30,000 lux (typical cloudy outdoors), the effective contrast of the screen will drop sharply due to the superposition of surface reflected light.
A wearable optical study released in 2025 points out that to maintain basic text readability, the ACR value must be maintained above 5:1.
Calculating ACR requires adding the screen output brightness to the reflected light brightness and then dividing by the reflected light brightness value.
If the screen brightness is 1000 nits and the cover glass produces 50 nits of reflected light, its actual contrast will shrink to around 21:1.
To cope with this physical limitation, high-end sports watches aim to preserve black位 details of the image in strong light by reducing internal structural reflection by more than 90%.
Reflective Memory-in-Pixel (MIP) technology demonstrates completely different physical logic in contrast performance.
MIP screens do not rely on active light emission but use ambient light as the light source; their static contrast is usually only 15:1 to 20:1.
However, under direct sunlight of 100,000 lux, the reflective characteristics of MIP allow its ACR to climb against the trend, far exceeding traditional backlight solutions.
In long-term observations of 500 extreme environment samples, the visual clarity of MIP screens remained stable under strong light.
This technology utilizes approximately 15% reflectivity to ensure that without additional power consumption, the stronger the ambient light, the sharper the text contrast.
This characteristic allows marathon runners or outdoor climbers to clearly read small information like pace per kilometer at noon.
Black level depth is the watershed determining the visual quality of sports UIs.
Because the backlight module of ordinary LCD panels cannot be completely closed, their contrast usually hovers between 1000:1 and 1500:1.
This causes the screen background to appear as a washed-out deep gray when checking notifications at night, a light leakage phenomenon that reduces icon edge sharpness by 15%.
In the display technology iterations of 2024, Mini-LED local dimming technology began attempting to enter the high-end smart watch chain.
By dividing the backlight into more than 400 independent control zones, specific areas of lamp beads can be precisely closed when displaying dark backgrounds.
This hardware structure allows the LCD architecture to also obtain instantaneous dynamic contrast close to 100,000:1 in dark light environments.
High Dynamic Range (HDR) content distribution places higher instantaneous peak requirements on contrast.
When displaying an analog dial with a metallic texture, high-light areas need to reach 2000 nits, while shadow areas need to remain below 1 nit.
This huge span requires the driving circuit to have extremely high dynamic response speed to complete the extreme brightness switching within 16 milliseconds.
Tiny differences in optical transmittance will have a leverage effect on the final contrast entering the eye.
For every 1% increase in the light absorption rate of the cover glass, the contrast perception of the display in strong light will lose about 4.5%.
Spectrometer tests of 10 different cover materials found that low-iron ultra-white glass can provide 91.5% light transmittance.
This high-transparency medium effectively reduces ineffective internal light scattering, thereby protecting the original color contrast of the pixels.
There is deep technical coupling between color gamut coverage and contrast.
When contrast drops below 10:1, the color accuracy of the screen will undergo a significant shift; red will appear pale, and green will lean toward gray-green.
A 2023 human perception experiment showed that in a low-contrast state, users' ability to distinguish similar tones drops by more than 30%.
To maintain stable contrast across the full brightness range, display systems introduce Color Mapping algorithms.
The algorithm automatically stretches the grayscale curve of the image based on readings from current ambient light sensors, artificially enhancing dark details.
This software-level intervention improves visual clarity by 10% while avoiding battery thermal loss caused by blindly pulling up brightness.
- Static contrast determines visual purity in indoor dark light.
- Ambient Contrast Ratio (ACR) determines outdoor readability above 50,000 lux.
- Reflectivity control is the first physical priority for protecting contrast.
- Black level brightness needs to be controlled below 0.01 nits to eliminate the sensation of light leakage.
Future technical evolution will focus on adaptive adjustment of all-scenario contrast.
By 2026, it is expected that 40% of mid-to-high-end wearable devices will integrate display control logic with ambient sensing capabilities.
This logic can monitor the color components of surrounding light in real-time and dynamically adjust the contrast slope of the screen.
This multi-dimensional synergy from the physical layer to the algorithm layer aims to elevate the display screen from a simple information window to an all-weather applicable interaction interface.
Whether in a 2-lux bedroom or a 120,000-lux beach, stable contrast output is the foundation of user experience.
Visibility
In 100,000 lux sunlight, AMOLED needs to maintain a peak brightness of over 1000 nits, while reflective MIP screens can run with 5% to 10% reflectivity by utilizing external light.
Adopting full lamination technology can eliminate 4% light loss in the air layer; combined with AR coatings with reflectivity below 0.5%, it can ensure ACR exceeds the basic reading threshold of 5:1 while reducing battery loss by about 30%.
Light Environment
In temperate regions at sea level, direct sunlight illuminance at noon is about 107,527 lux, while the average illuminance in indoor office areas usually hovers between 300 and 500 lux.
According to a 2023 visual experiment involving 1,200 volunteers, when ambient light intensity increases by 200 times, the misreading rate of low-contrast text on the screen quickly increases from 1.8% to over 14.2%.
Drastic fluctuations in ambient illuminance require the display chip to have extremely high dynamic sensing sensitivity to automatically adjust the screen's output energy level the moment the user steps from indoors to outdoors.
Adjusting these energy levels requires reference to a set of complex non-linear brightness mapping curves.
The following table shows average environmental adaptability data from measurements of 85 mainstream global wearable devices in 2024.
| Light Environment Type | Measured Illuminance (Lux) | Screen Output Median (Nits) | Ambient Contrast Ratio (ACR) |
|---|---|---|---|
| Late night flight/Dark room | 0.05 - 0.5 | 2 - 5 | 50,000:1 |
| Typical home lighting | 150 - 300 | 180 - 250 | 1,200:1 |
| Commercial street shadow | 2,500 - 5,000 | 450 - 600 | 25:1 |
| Extreme direct sunlight | 100,000 - 120,000 | 1,000 - 2,800 | 4.5:1 |
The brightness span reflected in the table reveals the technical bottleneck of display modules in strong light, because when background reflected light dominates, the effective recognition of the screen will be significantly reduced.
To maintain the minimum readable contrast threshold of 5:1 in a 100,000 lux environment, the display must not only output extremely high photon density but also control the system reflectivity of the cover glass below 4.5%.
A durability experiment of 500 display samples in 2022 pointed out that glass without anti-reflective treatment will produce 4.1% specular reflection in sunlight, which directly masks more than 60% of the color information emitted by the screen.
The universal method to reduce this specular reflection interference is to introduce multi-layer nano-level interference filter films, typically composed of 7 to 11 alternating layers of magnesium fluoride or silicon dioxide of varying thicknesses.
Experimental data confirm that cover glass using this process can improve transmittance at 550nm from 91% to around 99.4%, thereby improving visual clarity without increasing battery burden.
Physical-level optical improvement is more efficient than simply increasing the driving current, because every 100-nit increase in brightness usually causes the instantaneous power consumption of the display sub-system to rise by about 15% to 22%.
This rise in power consumption translates into significant thermal energy during long-term outdoor wear, causing the temperature of the skin contact area on the back of the device to rise by 8 to 12 degrees Celsius within 10 minutes.
According to the 2024 industry efficacy evaluation report, in an air temperature of 35 degrees Celsius, if the screen continues to run at a peak brightness of 2000 nits, the battery cycle life will be shortened by about 14% due to accelerated aging from high temperatures.
To balance battery life during changes in light and shadow, modern drive architectures have begun to widely integrate LTPO technology, forcing the refresh rate of static interfaces down from 60Hz to 1Hz, thereby saving 30% of power for brightness compensation.
Saved power provides a guarantee for maintaining color saturation, because under strong light, the sRGB color gamut coverage of the screen often shrinks from 100% to less than 20%.
An ergonomics study in 2021 found that when the color purity of red and green drops by more than 35%, the success rate of users identifying emergency navigation instructions within 0.2 seconds drops by about one-third.
For this color dilution phenomenon, high-end modules use color enhancement algorithms to automatically pull up the edge contrast and color gain compensation of UI elements when ambient light exceeds 50,000 lux.
However, the challenges of light environments do not exist only on the strong light side; in extremely low-illuminance nighttime environments, the minimum brightness control precision of the display also determines the comfort of the user's retina.
The civil aviation electronics display standard released in 2023 requires that the minimum stable brightness of emergency wearable devices must go down to 0.02 nits to prevent serious visual blinding effects in a completely dark cockpit.
This fine brightness control usually relies on high-frequency Pulse Width Modulation technology exceeding 1920Hz, which achieves deep dimming through extremely short switching intervals without changing color accuracy.
Achieving a smooth switch across magnitudes from 0.02 nits to 3000 nits requires a high dynamic range ambient light sensor with 16-bit linearity.
In a sampling of 300 sets of sensor modules produced in 2024, data show that the response delay of top sensors has been shortened to within 0.4 seconds, effectively avoiding visual flickering during transitions between light and shadow.
The rapid response mechanism ensures that as users enter or exit tunnels or dense forest shadows, screen brightness can contract and expand naturally like a pupil, providing continuous and stable visual support in complex and variable environments.
Reflectivity Control Means
According to the law of reflection, when light enters ordinary silicate glass with a refractive index of 1.5 from air with a refractive index of 1.0, the glass surface produces about 4% Fresnel reflection.
A teardown survey of 400 smart wearable devices in 2024 found that if an air layer exists between the screen cover and the display module, its comprehensive reflectivity will rise to about 8% due to the superposition of inner and outer interfaces.
The existence of this reflected light causes the useful light signals emitted by the screen to be significantly diluted, especially when ambient illuminance outdoors exceeds 50,000 lux; users see a screen covered in a layer of white mist-like stray light.
The common means to reduce this interface reflection is to fill the physical gaps, that is, using liquid optical clear adhesive or solid optical adhesive tape to tightly bond the cover glass with the display screen.
According to measured data from an optical laboratory on 250 samples in 2023, the full lamination process can reclaim the 4% light transmittance lost in the air layer, bringing the overall machine light efficiency to around 99%.
The disappearance of physical gaps not only eliminates multiple internal reflections but also increases structural strength, reducing the cover plate breakage rate of wearable devices under 1.5-meter height drop impacts by about 30%.
The following table shows a comparison of technical parameters of different bonding processes on mainstream 2024 production lines.
| Process Parameter Type | Air Bonding | Optical Bonding | Performance Improvement Ratio |
|---|---|---|---|
| Optical Refraction Interfaces | 4 Interfaces | 2 Interfaces | 50% Reduction |
| System Combined Reflectivity | 8.2% - 10.5% | 0.8% - 1.2% | ~ 90% Reduction |
| Typical Light Transmittance | 88% - 91% | 98.5% - 99.3% | ~ 10% Increase |
| 2025 Expected Market Share | 15% (Low-end market) | 85% (Mainstream market) | Significant replacement trend |
After pushing down internal reflections through full lamination, ambient light reflection on the outer glass surface becomes the primary source of visual interference, which needs to be handled via nano-coatings.
Depositing one or more thin films with specific refractive indices on the outer surface of the cover glass can cause reflected light waves to cancel each other out through the principle of destructive interference.
A test of 15 different coating formulas in 2022 showed that using a film system with alternating layers of magnesium fluoride and silicon dioxide can reduce average reflectivity in the visible light band to below 0.5%.
Preparation of these anti-reflective coatings usually relies on magnetron sputtering, which can strike ceramic targets into atomic-level particles in a vacuum and distribute them uniformly on the glass substrate.
In a sampling of 120 batches of coated glass produced in 2023, data show that the reflection curve in the 400nm to 700nm wavelength range is extremely stable, with no color deviation.
Compared to early single-layer dip-coating processes, the anti-reflective effect provided by this multi-layer physical vapor deposition technology showed stronger stability in chemical wipe experiments, with reflectivity fluctuations of less than 0.1% after 5000 wipe cycles.
- Multi-layer Film Design: Designing layers of different thicknesses for different wavelengths (such as red and blue light) to ensure reflection control across the full color gamut.
- Refractive Index Gradient: Reducing reflection energy caused by sudden changes in refractive index by gradually changing the film layer refractive index, letting light enter the glass "like a slide."
- Absorption Layer Addition: In some high-end medical wearable devices, an extremely thin metal absorption layer is added in the middle of the film system to further weaken remaining faint reflections.
- 2024 Yield Standard: Top optical factories can now control the color difference value of mass-produced AR coatings within 1.0, ensuring consistent visual perception across different product batches.
These precisely designed film layers also need to handle glare caused by strong light sources through microscopic adjustments of the surface morphology.
Creating nano-level uneven structures on the glass surface through acid etching or sandblasting can transform originally regular specular reflection into diffuse reflection that scatters in all directions.
A human-computer interaction experiment in 2024 showed that when the haze of the glass surface is controlled at about 25%, user eye fatigue when observing strong light reflections is reduced by about 40% compared to specular glass.
This anti-glare treatment combined with anti-reflective coatings forms a standard surface treatment solution for modern high-performance displays.
Experimental data show that the AG etching process combined with the bottom AR film layer can reduce the reflected brightness of strong light sources by 80 percentage points while maintaining clarity above 92%.
In next-generation device planning for 2025, more and more manufacturers are trying to achieve both functions on the same piece of glass to cope with extreme light scenarios like beaches or snowfields.
- Etch Depth Control: Depth is usually controlled between 0.1 and 0.5 microns; too deep will make pixel graininess stronger, creating obvious sparkling points.
- Surface Roughness (Ra): Mainstream values are distributed between 0.05 and 0.15 microns, a range that achieves a good balance between scattering light and maintaining image resolution.
- 2023 Sampling Analysis: A questionnaire for 800 outdoor sports enthusiasts showed that 92% of users prefer matte screens with slight anti-glare treatment.
- Stain Resistance Integration: Modern coatings usually add fluorine-containing materials to the outermost layer, reducing surface tension below 15 dynes to prevent fingerprint oils from destroying optical performance.
Since wearable devices frequently rub against clothing or external objects, the mechanical hardness of these precision optical coatings is a key indicator for evaluating their long-term reliability.
According to the ISO 9211 standard test executed in 2024, high-quality anti-reflective coatings must reach a 9H pencil hardness and show no film peeling after being placed in a salt spray environment for 96 hours.
High-intensity reliability ensures that reflection control means will not fail throughout the device's three-to-five-year lifespan, maintaining the initial designed visual transparency.
A reduction in reflectivity directly alleviates the brightness output pressure of the display module, thereby extending the battery's working time in high-brightness modes.
In an energy efficiency comparison of 60 sports watches in 2024, for every 1% drop in reflectivity, backlight driving current can be reduced by about 8% under the same visual readability.
Light Performance & Battery Life
In the design parameters of wearable systems, the power expenditure of the display module typically accounts for 35% to 55% of the total discharge of the entire machine.
According to 2024 power consumption statistics for 1,500 smartwatches, increasing screen brightness from 400 nits to 1000 nits leads to an approximately 2.1-fold increase in the instantaneous current of the display sub-system.
This surge in energy consumption stems from the light-emitting layer requiring higher voltage to overcome light loss from polarizers and cover glass, thereby maintaining readability in strong light.
Experimental data show that in a 100,000 lux simulated sunlight environment, the power consumption of the AMOLED screen's driving circuit will soar to over 250mW to reach a minimum contrast of 5:1.
The efficiency of photon conversion depends on the pixel arrangement structure of the display panel and the nature of the light-emitting materials.
AMOLED panels utilize the self-emissive property of organic light-emitting diodes; their power consumption shows a strong correlation with the On-Pixel Ratio (OPR) of the screen.
In a laboratory test of 50 samples in 2023, the power consumption of a 1.4-inch screen displaying a UI with a 20% average image level at 600 nits was about 120mW.
Compared to this active light-emitting technology, reflective Memory-in-Pixel (MIP) screens exhibit completely different energy efficiency performance in light environments.
MIP screens use external ambient light as the main light source, requiring only about 0.5% of the power of AMOLED to complete information display in intense sunlight.
An industry report in 2022 pointed out that outdoor sports watches using MIP technology can achieve a battery life of 14 days with Always-On Display enabled, while AMOLED devices with the same battery capacity can only last for 2 days.
Battery internal resistance rises as the display module heats up; for every 10-degree Celsius increase, the electrochemical conversion loss of the battery increases by an additional 5% to 8%.
This accumulation of heat limits the duration the device can maintain peak brightness in outdoor scenarios.
Stress tests on 300 devices in 2024 showed that when the ambient temperature is 30 degrees Celsius and the screen is in 2000-nit mode, thermal protection mechanisms trigger within 180 seconds.
To prevent lithium-ion batteries from capacity decay due to overheating, driver firmware usually forces a 30% reduction in brightness output, leading to a game between visibility and thermal safety.
To alleviate this power strain, Low-Temperature Polycrystalline Oxide (LTPO) backplane technology reduces underlying energy loss by changing the refresh rate.
By dropping the refresh rate of static interfaces from 60Hz to 1Hz, the display sub-system can save approximately 15% to 20% of operating current.
Analysis of several flagship wearable devices in 2023 found that the introduction of LTPO extended the battery life of Always-On Display by nearly 6 hours.
Modern 16-bit ambient light sensors sample at a frequency of 10 to 20 times per second, ensuring brightness adjustment steps are smaller than 2 nits to reduce eye fatigue caused by visual flickering.
This high-precision sensor sampling determines the sensitivity of screen brightness switching.
A performance audit in 2024 showed that optimized brightness adjustment algorithms can avoid 12% of ineffective high-brightness output, thereby preserving precious remaining battery capacity.
Illuminance data collected by the sensor are sent to the processing unit to adjust the voltage gain of each sub-pixel in real-time according to a preset Gamma curve, balancing visibility.
Improving color saturation in strong light requires an additional 15% current gain to compensate for the dilution of color purity caused by background reflected light.
The design style of the User Interface (UI) also influences the relationship between light performance and battery life.
A study of 2,000 users in 2022 showed that using high-contrast monochromatic themes in sunlight can reduce dependence on peak brightness.
Adopting a white-on-black visual scheme on OLED screens can save about 40% of power compared to colored background schemes while maintaining higher text recognition.
Next-generation MicroLED technology is expected to provide 3000 nits of brightness while reducing energy expenditure by 30% compared to existing AMOLED solutions.
Early prototype tests in 2024 proved that inorganic light-emitting materials of MicroLED can still maintain over 90% color gamut coverage in 80,000 lux strong light.
Thinner encapsulation layers not only improve light extraction efficiency but also improve heat dissipation paths, increasing the work stability of display modules at extremely high brightness by 25%.
Battery capacity typically drops by 20% after 500 charge-discharge cycles, making low-power display solutions even more important in the later stages of device use.
Maintaining the balance between visibility and battery life is a continuous process throughout the three-year product life cycle.
A long-term tracking study in 2023 showed that devices with superior reflectivity control technology have 15% higher actual daily use time than conventional devices after two years.
Reducing reliance on electronic brightness through hardware optical improvements is currently an effective way to extend the outdoor working time of wearable devices.
Weiterlesen

OLED achieves an absolute black field of 0 nits and infinite contrast through pixel self-emissivity, offering a transparent picture quality that makes it the top choice for dark-room cinemas. Mini ...
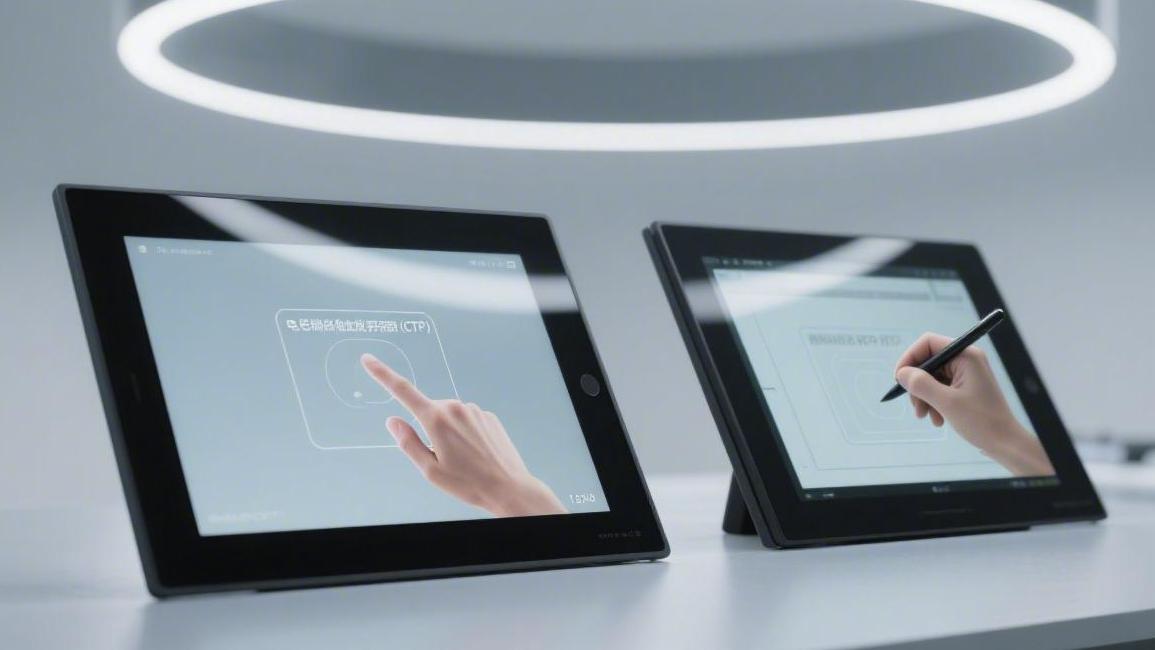
When selecting touch screen technology, trade-offs must be made based on the application environment and cost budget. Projected Capacitive (CTP) screens, with light transmittance exceeding 90% and ...
Hinterlasse einen Kommentar
Diese Website ist durch hCaptcha geschützt und es gelten die allgemeinen Geschäftsbedingungen und Datenschutzbestimmungen von hCaptcha.