


Custom TFT Displays vs. Off-the-Shelf | Performance, Cost
Custom TFT screens can precisely match performance requirements, such as industrial-grade wide temperature range (-30℃ to 80℃) and high brightness (1000 nits), but involve high development costs (NRE fees starting at $50,000) and a lead time of 8-12 weeks.
Off-the-shelf screens have lower costs (unit price might be only 1/3 of custom screens) and faster delivery (1-2 weeks), but offer generic performance, often with brightness only around 500 nits.
Performance
The brightness of off-the-shelf TFTs is typically in the range of 250-500 nits, making them difficult to use under strong outdoor light; whereas custom solutions can easily exceed 1000 nits, even reaching up to 2500 nits, and utilize optical bonding technology to increase contrast ratio to over 1500:1, effectively eliminating ambient light reflection.
In extreme cold of -30℃ or high heat of +85℃, commercial off-the-shelf screens cannot display normally, but custom displays using wide-temperature liquid crystal and industrial-grade drivers can maintain millisecond-level response times.
For medical diagnostics or high-speed instruments, custom screens support factory color calibration for each unit, achieving professional color accuracy with ΔE<2, and optimize gray-to-gray response time to under 5 milliseconds, eliminating motion blur.
Performance Parameters
Engineering Implementation of Brightness and Contrast
Increasing brightness requires a comprehensive approach to optical design, thermal management, and power control. Standard screen brightness is typically in the 250-500 nits range, while high-end custom displays can achieve:
- 1000-1500 nits (Suitable for semi-outdoor environments, like gas station payment terminals)
- 2000-2500 nits (Full outdoor applications, like marine navigation equipment, engineering machinery control consoles)
- 3000 nits and above (Special applications, like aircraft cockpit displays)
Achieving high brightness requires the use of high-luminosity-efficiency LED light bars and a redesign of the light guide plate structure.
Concurrently, this leads to increased power consumption: increasing brightness from 500 nits to 1500 nits typically increases backlight power consumption by 250-300%.
Contrast ratio improvement is primarily achieved through optical bonding technology.
Unbonded standard screens have a contrast ratio of about 500:1 to 800:1.
By using full lamination technology, internal reflection can be reduced, increasing the contrast ratio to 1200:1 to 1500:1.
In high-end medical diagnostic displays, the contrast ratio may even need to exceed 2000:1 to accurately distinguish subtle grayscale variations.
Temperature Range and Material Selection
The operating temperature range directly determines the application scenarios for the display.
Commercial-grade screens typically have an operating temperature range of 0℃ to 50℃, while custom displays can extend this range through the following methods:
- Wide-temperature liquid crystal material: Ensures response time remains below 300ms even at -30℃, avoiding low-temperature smearing.
- Industrial-grade polarizers: Will not produce bubbles or deform in high-temperature environments up to 85℃.
- High-temperature resistant backlight materials: LED driver circuits require capacitors rated for temperatures of 105℃ or higher.
Specific temperature range examples:
- Industrial Basic Grade: -20℃ to 70℃
- Automotive Front-Mount Grade: -40℃ to 85℃ (meeting ISO 16750 standard)
- Special Outdoor Grade: -40℃ to 95℃
In a -30℃ low-temperature environment, the startup time for a standard screen may extend to over 30 seconds, while wide-temperature custom screens, by optimizing power sequencing and liquid crystal drive voltage, can control startup time within 5 seconds.
Color Accuracy and Production Control
Color accuracy is quantified by the ΔE value, representing the degree of color deviation.
Standard screens typically have a ΔE greater than 5, while professional custom displays can achieve:
- ΔE < 3.0 (Meeting ordinary design requirements for the sRGB color space)
- ΔE < 2.0 (Color-sensitive applications like printing, photography)
- ΔE < 1.5 (Medical diagnostics, professional color grading)
Achieving high color accuracy requires three steps:
- Use of high-quality panels with native color gamut exceeding 100% sRGB or 95% DCI-P3.
- Individual calibration of each display unit on the production line using a spectrophotometer.
- Generation and burning of a 3D LUT (Look-Up Table) into the display driver board.
Taking medical grayscale displays as an example, they need to simultaneously meet:
- Accurate display of 1024 shades of gray (10-bit color depth).
- Luminance stability: Luminance decay not exceeding 10% over a 30,000-hour service life.
- Certification according to the DICOM Part 14 standard.
Response Speed and Dynamic Image Optimization
Response time directly affects the clarity of dynamic image display. The gray-to-gray response time of standard screens is typically 20-40ms, causing visible smearing in fast-moving images. Custom solutions can optimize this through:
- Using fast liquid crystal materials to reduce response time to 8-15ms.
- Employing overdrive technology, by optimizing voltage control, to further reduce response time below 5ms.
For gaming monitors and industrial inspection equipment that need to display high-speed waveforms or video, the refresh rate is also increased from the standard 60Hz to:
- 120Hz (Mid-range gaming and industrial applications)
- 144Hz/165Hz (High-end gaming displays)
- 240Hz and above (Professional e-sports and special monitoring purposes)
At a 60Hz refresh rate, the display time per frame is 16.7ms; when the refresh rate increases to 120Hz, the display time per frame shortens to 8.3ms, improving dynamic image clarity by about 40%.
Viewing Angles and Color Stability
Standard IPS screens, when viewed at a 45-degree angle, typically see their contrast ratio drop below 50:1.
Custom displays, by optimizing liquid crystal alignment and using film compensation technology, can maintain within a 178-degree viewing angle:
- Contrast ratio maintained above 100:1
- Color shift Δu'v' less than 0.015 (CIE 1976 chromaticity standard)
Impact of Optical Bonding Technology on Parameters
The choice of optical bonding process directly affects multiple optical parameters:
| Bonding Type | Thickness Increase | Contrast Ratio Improvement | Anti-Reflection Effect | Structural Rigidity |
|---|---|---|---|---|
| Air Gap (Unbonded) | Baseline | Baseline (500:1) | Baseline | Baseline |
| Liquid Optically Clear Adhesive (LOCA) Bonding | 0.5-0.8mm | Increased to 800:1 | 30% Reflection Reduction | 2x Improvement |
| OCA Full Lamination | 0.3-0.5mm | Increased to 1200:1 | 60% Reflection Reduction | 3x Improvement |
| Optical Gel Fill | 1.0-1.5mm | Increased to 1500:1 | 80% Reflection Reduction | 5x Improvement |
Full lamination, while adding 0.3-1.5mm of thickness, significantly improves optical performance.
For example, under 1000 nits of ambient light, the readability contrast ratio of an unbonded screen drops to 1.5:1, while a screen with quality optical bonding can maintain a readability contrast ratio of 3:1.
Performance Dimension Comparison
Actual Performance of Brightness Parameters
Brightness values directly affect the usability of the device under different environmental conditions. The following is a comparison of measured data between the two types of screens:
| Environmental Conditions | Off-the-shelf Screen (500 nits) | Custom Screen (1500 nits) | Usage Scenario Description |
|---|---|---|---|
| Indoor Office (300-500 lux) | Good Visibility | Excellent Visibility | Difference is not significant |
| Outdoor Overcast (2000-3000 lux) | Needs to run at maximum brightness | Maintains 70% brightness sufficient | Custom screen has lower power consumption |
| Direct Sunlight (10000 lux) | Content difficult to discern | Remains clearly readable | Essential for car navigation |
| Night Mode (10 nits) | Supported | Supports 0.5 nit dim light | Custom screen has a wider brightness adjustment range |
Measured data shows that under 10,000 lux of strong light, the contrast ratio of a 500-nit screen drops to 1.5:1, while a 1500-nit screen can maintain a readable contrast ratio of 3:1.
Hard Indicators of Temperature Adaptability
The temperature range is a key indicator distinguishing commercial-grade from industrial-grade displays. Test data indicates:
At -20℃ environment:
- Commercial-grade screen startup time exceeds 30 seconds
- Industrial-grade custom screen can start within 8 seconds
- Response time difference: Standard screen over 80ms, wide-temperature screen maintains 25ms
In +85℃ high-temperature testing:
- Standard screen backlight brightness decays by 30% within 2 hours
- Industrial-grade screen uses high-temperature resistant LEDs, brightness decay <5% over 4 hours
After temperature cycling tests (-40℃ to +85℃, 1000 cycles), the failure rate of commercial-grade screens reaches 12%, while that of automotive-grade custom screens is controlled below 0.1%.
Graded Standards for Color Accuracy
Color accuracy requirements vary by application scenario, with specific comparisons as follows:
Medical Diagnostic Displays (compliant with DICOM standard):
- Need to support 10-bit color depth (1.07 billion colors)
- Color accuracy requirement of ΔE<2.0
- Luminance uniformity >85%
- Require monthly calibration verification
Industrial Control Displays:
- ΔE<4.0 is acceptable
- Greater emphasis on brightness and contrast stability
- Typically do not require professional calibration equipment
Consumer-grade Displays:
- ΔE<5.0 is the passing threshold
- More focus on color saturation than absolute accuracy
- Allow 5-10% luminance non-uniformity
Real Impact of Response Speed
Response time determines the clarity of dynamic images. Test data indicates:
- At 60Hz refresh rate:
- 20ms response time causes 3-4 pixels of smearing
- 5ms response time limits smearing to within 1 pixel
- For displaying scrolling text, slow response reduces readability by 40%
- Requirements for high refresh rate displays:
- 120Hz refresh rate requires <8.3ms response time
- 240Hz gaming displays require <4.2ms response time
- Each additional frame of delay increases game operation response delay by 8.3ms
Quantified Data on Reliability and Lifespan
Accelerated aging tests show that under the following conditions:
- Temperature: 60℃
- Humidity: 90%RH
- Continuous operation for 1000 hours
The brightness decay of commercial-grade screens reaches 15-20%, while that of industrial-grade custom screens is controlled within 5%. In terms of expected service life:
- Commercial-grade: 30,000 hours (brightness decays to 50% of initial value)
- Industrial-grade: 50,000 hours (brightness maintains above 70% of initial value)
- Automotive-grade: 80,000 hours (brightness maintains above 80% of initial value)
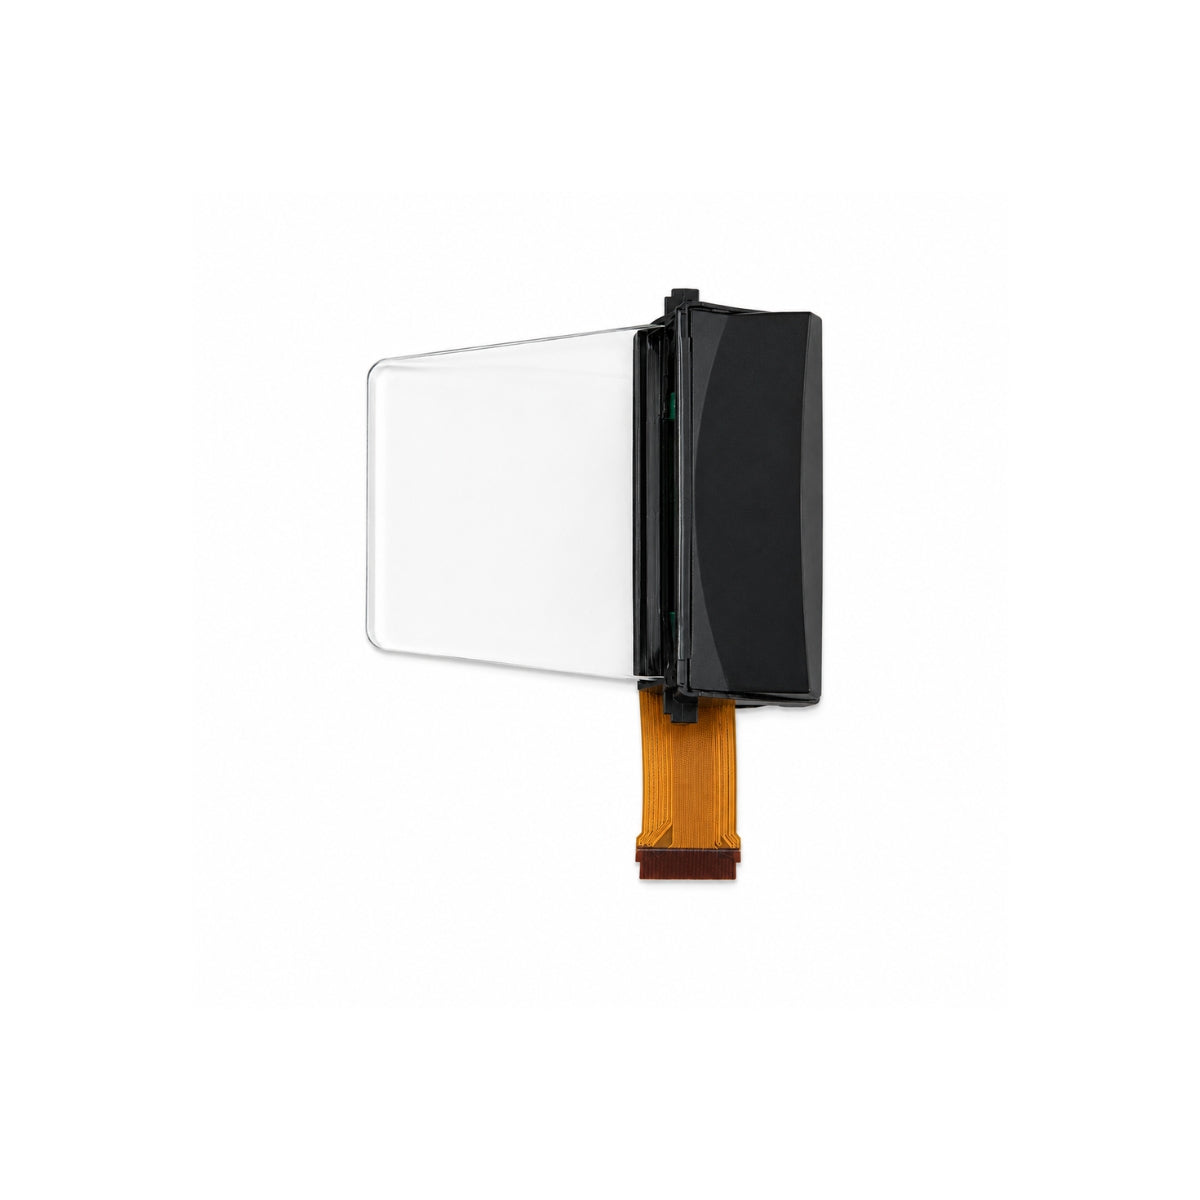
Optical Bonding
Basic Principles and Types
When an air gap exists between the display and the cover glass, approximately 8% of incident light is reflected at each interface.
These two reflections can lead to an overall reflectance of over 15%.
The refractive index of optical adhesives (typically 1.48-1.52) is close to that of glass (1.51).
By filling the air gap, interface reflection can be reduced to below 1%.
Main bonding methods include:
Liquid Optically Clear Adhesive (LOCA) Bonding:
-
Uses UV-curable adhesive, thickness can be controlled between 0.1-0.3mm
-
Curing time 30-60 seconds, suitable for flat structures
-
Refractive index matching accuracy can reach ±0.01
Solid Optical Clear Adhesive (OCA) Bonding:
-
Uses pre-cut OCA film, thickness 0.125-0.5mm
-
Requires lamination in a cleanroom environment, suitable for curved designs
-
Higher yield rate, but requires significant equipment investment
Improvement Effects on Display Parameters
Measured data indicates that optical bonding can bring the following specific improvements:
Brightness Utilization Improvement:
-
Brightness loss for unbonded screens is about 15-20%
-
Brightness loss for bonded screens is reduced to 5-8%
-
Under the same backlight power consumption, light output efficiency increases by 10-15%
Contrast Ratio Changes:
-
Ambient light reflectance drops from 12-15% to 2-4%
-
Actual usable contrast ratio increases by 3-5 times
-
Under 1000 lux ambient light, contrast ratio improves from about 5:1 to 25:1
Effect Comparison of Different Bonding Processes:
|
Parameter |
No Bonding |
LOCA Bonding |
OCA Bonding |
|---|---|---|---|
|
Thickness Increase |
Baseline |
0.3-0.5mm |
0.2-0.4mm |
|
Reflectance |
12-15% |
4-6% |
2-3% |
|
Transmittance |
85-88% |
90-92% |
93-95% |
|
Processing Yield |
>98% |
92-95% |
90-93% |
Structural Reinforcement and Durability Improvement
The adhesive layer not only improves optical performance but also enhances the structural integrity of the display:
Impact Resistance:
-
For unbonded screens, impact stress concentrates on the touch layer.
-
After bonding, impact energy is absorbed and dispersed by the adhesive layer.
-
Pass rate for 1-meter drop test increases from 60% to 85%.
Vibration Resistance:
-
Bonded screens show no abnormalities in 5-500Hz vibration tests.
-
Unbonded screens may exhibit display abnormalities at resonant frequencies.
Dust and Water Protection:
-
Eliminates the air gap, preventing moisture condensation.
-
Combined with sealing design, can achieve IP65 protection rating.
Bonding Requirements for Different Application Scenarios
Depending on the usage environment, the bonding process requires targeted optimization:
Outdoor Equipment Bonding:
-
Adhesive layer must be UV resistant to avoid yellowing.
-
Operating temperature range -30℃ to 85℃.
-
Emphasis on anti-reflection function, reflectance needs to be <2%.
Automotive Display Bonding:
-
Requires high reliability, passing automotive vibration standards.
-
Adhesive layer must have low volatility to prevent air quality issues inside the vehicle.
-
Typically uses 0.3mm thickness OCA.
Medical Display Bonding:
-
Adhesive layer requires biocompatibility certification.
-
Strict limits on Volatile Organic Compound content.
-
Emphasis on optical uniformity, deviation <3%.
Implementation Considerations for the Bonding Process
Implementing optical bonding requires considering the following engineering factors:
Equipment Investment:
-
Semi-automatic bonding line: $200,000 - $500,000
-
Fully automatic bonding line: $1 million - $3 million
-
Cleanroom requirement: Class 1000 or better
Material Cost:
-
LOCA cost: $0.3 - $0.8 per inch diagonal
-
OCA cost: $0.5 - $1.2 per inch diagonal
-
Processing scrap rate: 5-8%
Production Cycle:
-
Small batch production: 2-3 days
-
Mass production: Weekly capacity of 10,000 - 20,000 units
Reliability Testing Standards
Bonded screens must pass strict environmental tests:
High Temperature/Humidity Test:
-
85℃/85%RH, 1000 hours
-
Requirement: No bubbles, no delamination
-
Brightness decay <5%
Thermal Shock Test:
-
-40℃ to 85℃, 100 cycles
-
30 minutes per cycle
-
Requirement: No functional failure
UV Aging Test:
-
Cumulative energy 300 kLy
-
Requirement: Yellowness index change <0.5
Performance Stability
Brightness Maintenance and Backlight Lifespan
Brightness decay is a key indicator for measuring display lifespan. Test data shows the decay curves of different backlight solutions:
LED backlight decay data at room temperature:
- 10,000 hours: Commercial-grade screen brightness decays 15-20%, industrial-grade decays 5-8%
- 30,000 hours: Commercial-grade brightness drops to 50% of initial value, industrial-grade maintains above 70%
- 50,000 hours: Industrial-grade screen brightness can still maintain 60% of initial value
Accelerated aging test conditions (85℃ ambient temperature):
- 500 hours of testing is equivalent to 3000 hours of normal use
- Commercial-grade LED luminous flux decay ≥20%
- Industrial-grade LED luminous flux decay ≤8%
Impact of different brightness settings on lifespan:
- Operation at 100% brightness: lifespan about 20,000 hours
- Operation at 75% brightness: lifespan extended to 35,000 hours
- Operation at 50% brightness: lifespan can exceed 50,000 hours
Long-Term Maintenance of Color Accuracy
Color stability is maintained through periodic calibration:
Calibration requirements for professional medical displays:
- Initial calibration ΔE<1.5
- Monthly calibration verification ΔE<2.0
- Quarterly comprehensive calibration ΔE<1.8
- Annual performance assessment, luminance uniformity >85%
Impact of ambient temperature on color:
- For every 10℃ temperature increase, white point chromaticity coordinates shift by 0.002-0.005
- Commercial-grade screens exhibit color temperature shift of 200-300K at 50℃ environment
- Industrial-grade screens control color temperature shift within 100K
Performance Under Temperature Cycling
Extreme temperature cycling test results (-40℃ to 85℃, 100 cycles):
Commercial-grade screen:
- Cycle 20: 3 dead pixels appear
- Cycle 50: Luminance non-uniformity reaches 25%
- Cycle 100: Touch function fails
Industrial-grade screen:
- After 100 cycles: Brightness decay <3%
- No pixel failures
- Touch accuracy maintained within ±1mm
High Temperature/Humidity Test (60℃/90%RH, 500 hours):
- Commercial-grade screen shows significant yellowing, chromaticity coordinate shift of 0.012
- Industrial-grade screen chromaticity coordinate shift <0.003
- Custom screens using moisture-proof design pass 96-hour dual 85 test
Reliability Under Vibration Environments
Vibration test standards for different application scenarios:
Automotive display vibration test:
- Frequency range: 5-500Hz
- Acceleration: 1-3G
- Duration: 8 hours per axis
- Requirement: No mechanical loosening, normal display function
Industrial equipment vibration test:
- Random vibration: 0.01G²/Hz (10-500Hz)
- Duration: 1 hour per axis
- Displacement amplitude: ±1.5mm (5-25Hz)
Military equipment vibration standard:
- MIL-STD-810G method
- Shock: 30G, 11ms
- Transport vibration: 3.5G RMS
Impact of Component Aging on Performance
Lifespan matching of key components:
LED backlight system:
- Industrial-grade LED luminous flux maintenance (L70) >50,000 hours
- Driver IC operational lifespan >100,000 hours
- Capacitor lifespan (105℃) >6,000 hours
Liquid crystal material stability:
- Response time change rate <15% (over 10,000 hours)
- Contrast ratio decrease <20% (end of life)
- No image persistence (240-hour continuous display test)
Touch sensor durability:
- Single-point touch >1 million cycles
- Multi-touch >500,000 cycles
- Surface hardness >7H (pencil hardness)
Parameter Drift During Long-Term Use
Parameter changes after 10,000 hours of continuous operation:
| Performance Parameter | Commercial-grade Change Range | Industrial-grade Change Range | Test Conditions |
|---|---|---|---|
| Luminance Uniformity | Decrease 15-25% | Decrease 3-8% | 9-point measurement |
| Color Temperature Uniformity | Shift 300-500K | Shift 50-100K | D65 standard |
| Gamma Value | Change 0.1-0.3 | Change 0.05-0.1 | 2.2 standard |
| Response Time | Increase 20-40% | Increase 5-15% | Gray-to-gray transition |
Protection Rating and Environmental Contamination
Impact of protection rating on stability:
IP54 Rating (Dust and water splash protected):
- Protects against solids larger than 1mm
- No harmful effects from water splashing from any direction
- Suitable for indoor industrial environments
IP65 Rating (Dust tight and protected against water jets):
- Completely dust tight
- No harmful effects from low-pressure water jets
- Suitable for outdoor and harsh environments
Special environmental protection:
- Chemical resistance: Resistant to alcohol, cleaners
- Scratch resistance: Surface hardness ≥8H
- Anti-glare: Haze 20-30%, Gloss 60-80 GU
Performance stability needs to be considered from the design stage. By selecting high-specification components, optimizing thermal design, and strengthening structural protection, consistent performance of the display can be ensured throughout the entire product lifecycle.
Test data indicates that industrial-grade custom displays can maintain over 85% of their initial performance after 5 years of use, while commercial-grade displays typically maintain only 60-70% of their performance level.
Cost
Off-the-shelf screens have low unit prices (e.g., a 5-inch HD screen might cost around $12-18) and no Non-Recurring Engineering (NRE) fees, making them suitable for small-batch projects.
However, although custom screens require upfront NRE fees ranging from $15,000 to $80,000, when annual production volume exceeds 100,000 units, their optimized per-unit cost can approach that of off-the-shelf screens.
Off-the-Shelf Displays
A mass-produced 7-inch HD (1280x800) IPS LCD module can have a unit price as low as $22-28 when procuring 10,000 pieces in a single order.
For the same specification display, if the procurement quantity is only 1,000 pieces, the unit price might be as high as $35-45.
The off-the-shelf screen market has a clear price stratification system, typically divided into three tiers:
-
High-End Brand Tier: Represented by manufacturers like Japan Display Inc. (JDI) or Sharp. These screens use top-tier liquid crystal materials and processing chips, offering the best color consistency, viewing angles, and reliability. Their prices are typically 20%-35% higher than standard products.
-
Standard Commercial Tier: Represented by manufacturers like AU Optronics (AUO) or Innolux. This is the most mainstream choice, balancing performance, lifespan, and cost, meeting the needs of the vast majority of consumer electronics and industrial applications.
-
Economy Tier: Mainly from numerous small and medium-sized module factories. They may use A-grade or screened LCD panels, posing risks in long-term reliability and consistency, but their prices are the most aggressive, potentially 15%-25% lower than the standard commercial tier.
In addition to the screen itself, hidden costs must be factored in:
-
Adaptation Costs: If the selected off-the-shelf screen's mechanical dimensions (e.g., 2.1 inches vs. 2.0 inches), interface voltage (e.g., 3.3V vs. 1.8V), or backlight drive method do not perfectly match your design, engineers need to add extra level-shifting chips, power regulation circuits, or structural adapters. The cost of these additional components might be between $1.5-$3, increasing PCB layout complexity and potential failure points.
-
Software Adaptation Costs: Even for "plug-and-play" screens, engineers may spend several days on driver debugging, color calibration, and touchscreen calibration. At an estimated cost of $120 per hour for a US engineer, this hidden development cost can easily reach $2,000-$4,000.
-
Certification and Testing Costs: If your product needs to enter the EU or North American markets, it must undergo CE, FCC, and other certifications. If the screen is changed, the entire product may need to be partially or fully re-tested for certification, with a single cost reaching $10,000-$30,000.
Supply chain volatility is another major risk. Display manufacturers typically issue a "Product Change Notification (PCN)" or "End-of-Life (EOL)" notice 6-12 months before discontinuing a product.
-
Last Time Buy: You must estimate the total demand for the remaining product lifecycle and place a one-time, potentially very large, final order. This ties up significant warehouse space and cash flow.
-
Finding and Qualifying an Alternative: Engineers need to find a functionally compatible new screen, a process that may take 4-8 weeks. This must be followed by a series of rigorous compatibility tests, high/low-temperature tests, lifespan tests, etc., to verify the new screen's reliability. The engineering cost for this process might be between $15,000-$50,000, and the production line faces shutdown risks during this period.
To systematically manage these risks, mature procurement teams adopt the following strategies:
-
Multi-Source Procurement: During the product design phase, prioritize screen models that have second sources or pin-compatible alternatives. This effectively weakens the bargaining power of a single supplier and provides a backup plan in case of supply disruption.
-
Lifecycle Buy: Sign a Long-Term Agreement (LTA) with the supplier or authorized distributor (like Arrow, Avnet) or perform a Lifetime Buy, purchasing the total estimated screen requirement for the entire product lifecycle in one go.
-
Select Long-Life Products from Standard Series: Major display manufacturers (like AUO, Innolux) often offer "Industrial Grade" or "Long-Life" product lines. These models typically have a guaranteed supply period of 5-7 years, much longer than the 1-2 years for consumer-grade products, but their prices are correspondingly 10%-20% higher.
Custom Displays
Understanding the Specific Composition of NRE Fees
NRE is not a vague expense; it precisely pays the engineering team at the display manufacturer or design company for the following quantifiable tasks:
-
Custom Optical Design: Adjusting the liquid crystal cell thickness, optimizing the combination of color filters and brightness enhancement films according to your requirements. For example, achieving 1000 nits high brightness for sunlight readability requires a backlight design with more or higher efficiency LED chips and a matching high-efficiency light guide plate. This design cost might be between $8,000 and $15,000.
-
Circuit and Interface Customization: Developing custom driver boards and T-Con chips. Converting an LVDS interface to MIPI DSI or integrating a dedicated touch controller chip involves hardware design and debugging costs, potentially ranging from $12,000 to $20,000.
-
Firmware and Driver Development: Writing low-level code to ensure proper screen startup, initialization sequences, and optimized color performance. Supporting advanced features like adaptive brightness or local dimming increases complexity, with development costs around $5,000 to $10,000.
-
Sample Production and Validation: Producing 3-5 rounds of engineering samples (EVT/DVT) and conducting high/low-temperature tests, vibration tests, accelerated lifespan tests, etc. The cost per round of sample production and testing is approximately $3,000 to $6,000.
How Customization Lowers the Total Product Cost
The return on investment for a custom display lies in optimizing the entire product's Bill of Materials (BOM) and production efficiency, not just the screen's unit price.
-
Component Integration: A standard off-the-shelf display module typically includes the screen itself, a separate driver board, and connectors. Through customization, you can integrate the driver IC, touch controller, and even a power management unit reserved for your main processor onto a smaller board. This system-level integration can save 15% to 20% of layout space on the mainboard, sometimes even allowing the use of a mainboard with fewer layers and a lower cost.
-
Simplified Production Assembly: A fully custom form factor and predefined connector positions enable automated pick-and-place operations. On the assembly line, this can reduce the installation time per station from an average of 45 seconds to under 20 seconds. For a production line with a daily output of 2000 units, this saves over 13 hours of labor per day.
-
Increased End-Product Value: A round custom display might cost $8 more than a standard rectangular screen, but it can give your smart home hub a unique design language, allowing a retail price premium of $20 or more.
Determining the Production Volume Break-Even Point for Customization
Is there a specific production volume number below which customization is not cost-effective? The answer is yes, but this point varies by project.
You can make a preliminary judgment using a simplified formula: Acceptable additional cost per screen = Total NRE Investment / Estimated Total Production Volume.
For example:
-
Total NRE Investment = $55,000
-
Project Lifecycle Total Production Volume = 150,000 units
-
NRE cost allocated per device = $55,000 / 150,000 ≈ $0.37/unit
At this point, if the procurement price of the custom screen is only $0.50 higher per unit than the off-the-shelf screen, the total incremental cost is $0.87/unit.
You need to assess whether the BOM cost savings from integration, the improvement in production efficiency, and the premium from product differentiation can exceed this $0.87.
Typically, when the expected annual production volume is steadily above 50,000 units, it is worthwhile to initiate an economic evaluation of customization.
Managing Potential Risks in Custom Projects
Customization also comes with financial and technical risks that must be managed:
-
Design Iteration Costs: If major modifications are required during the EVT or DVT stages, each design revision may incur additional costs of $3,000 to $10,000 and cause project delays of 4 to 6 weeks.
-
Supplier Selection Risk: A supplier with a low bid but lacking experience may face yield issues during mass production. For example, a supplier promising 90% yield but actually achieving only 80% means you need to pay for 125 screens to get 100 good ones, a 25% cost overrun. Choosing a supplier certified to IATF 16949 (automotive) or ISO 13485 (medical), even if their quote is 10%-15% higher, can provide more reliable long-term quality assurance.
-
Minimum Order Quantity (MOQ) Constraints: Suppliers often require an initial order quantity of no less than 5,000 to 10,000 units to cover their production line setup and raw material stocking costs. This requires a one-time investment of $150,000 to $300,000 in raw material funds, putting pressure on cash flow.
더 읽기
IPS modules extend lifespan via aluminum heatsinks + thermal paste (core ≤45°C, below 50°C industry max) cutting thermal stress, and 12V±0.6V supply (JEDEC-compliant) avoiding voltage damage. Accel...
Selecting a TFT module must closely align with specifications and interfaces. Resolution (e.g., 800x480) and brightness (starting at 500 nits) are fundamental; industrial scenarios require attentio...
댓글 남기기
이 사이트는 hCaptcha에 의해 보호되며, hCaptcha의 개인 정보 보호 정책 과 서비스 약관 이 적용됩니다.