


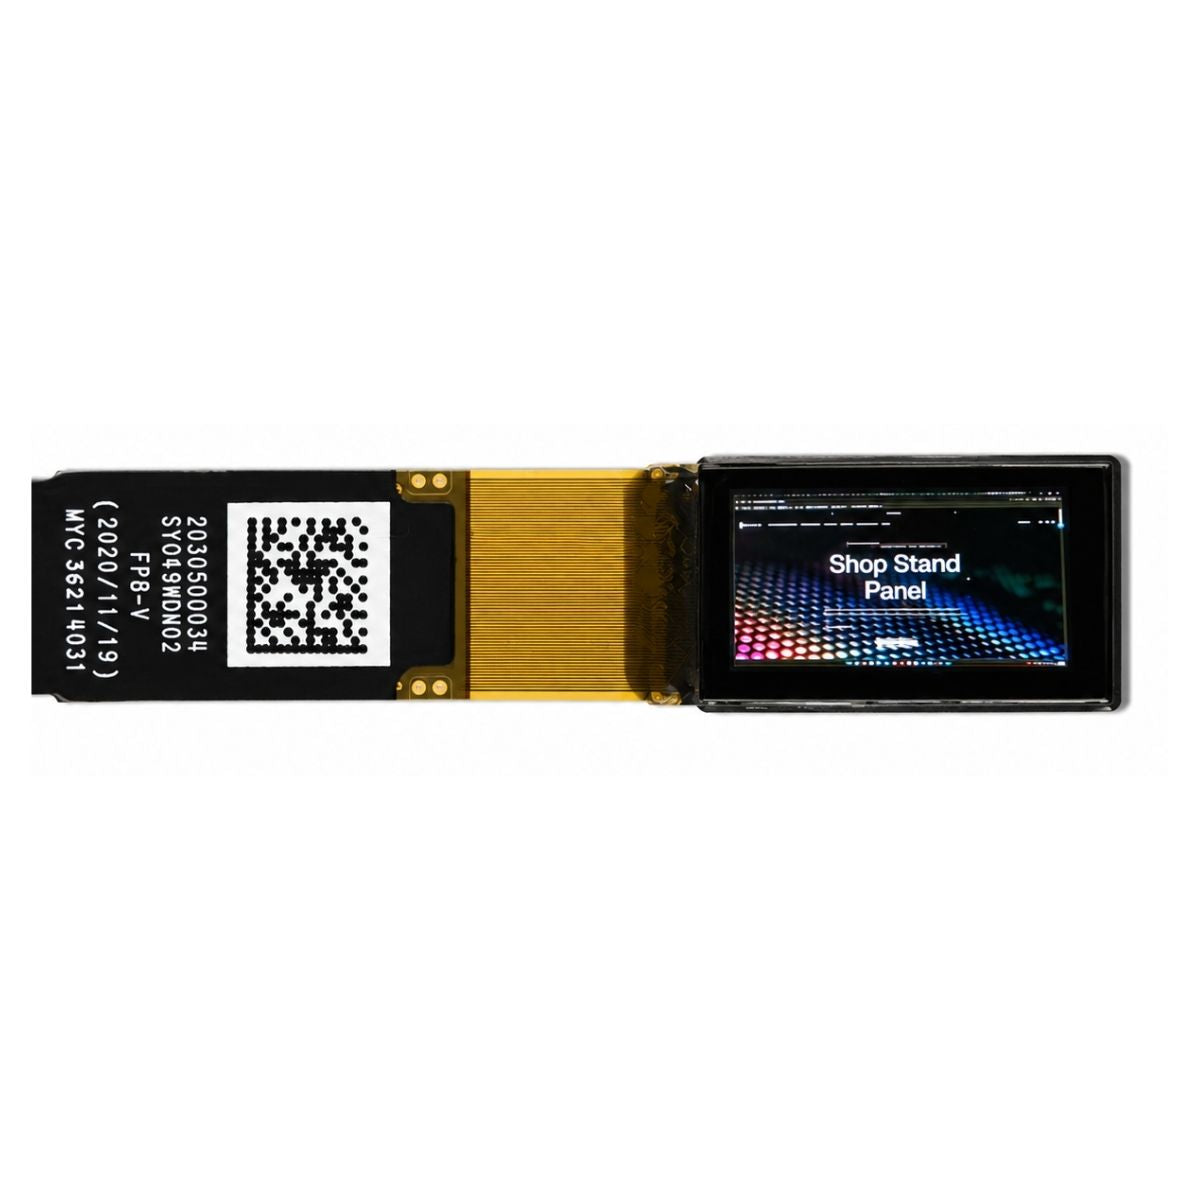


How Much Power Does PMOLED Module Consume
A typical 1.2-inch PMOLED module, when displaying static images, consumes roughly 12-18 mA at 3.3V, equating to 40-60 mW—while standby power plummets to just 0.5-1 μA.
Static Power Basics
Take a common 1.3-inch, 128x128 resolution monochrome PMOLED: at 3.3V, each lit pixel draws ~0.5μA. If your display shows a small icon covering 10% of the screen (about 1,638 pixels), total current hits ~0.82mA, translating to 2.7mW (3.3V × 0.82mA).
PMOLED’s static consumption hinges on three things: First, pixel count—a full-screen static image on that same 1.3” module lights all 16,384 pixels. At 0.5μA per pixel, total current jumps to 8.2mA, pushing power to 27mW (3.3V × 8.2mA), but 10x higher than a small icon. Second, per-pixel current varies with materials: newer PMOLEDs use organic compounds that cut current to 0.3–0.4μA per pixel, lowering static draw by 20–40% versus older designs. Third, voltage—most run at 3.3V, but some low-power variants use 1.8V, slashing power further (e.g., 8.2mA at 1.8V = 14.8mW instead of 27mW).
Single-color PMOLEDs (white/black) have simpler pixel circuits, using ~25% less static power than dual-color modules (e.g., red/blue), which need extra layers to control two colors. And brightness? Raising it from 50% to 100% increases per-pixel current by ~30%—so that 2.7mW icon now draws 3.5mW.
Here’s how real-world scenarios stack up:
|
Use Case |
Lit Pixels |
Per-Pixel Current |
Total Current |
Power (3.3V) |
|---|---|---|---|---|
|
Smartwatch time display |
5% |
0.4μA |
0.33mA |
1.1mW |
|
Fitness tracker step count |
8% |
0.45μA |
0.59mA |
1.9mW |
|
Full-screen logo |
100% |
0.5μA |
8.2mA |
27mW |
For battery-powered gadgets, this matters: a watch using this PMOLED spends ~1.1mW on static time display. Over 24 hours, that’s 26.4mWh—less than 1% of a 3,000mAh battery’s 11,160mWh capacity.
What Drives Dynamic Power
A 1.3-inch 128x128 monochrome PMOLED updating content every second draws ~50mW (3.3V × 15mA) at 60Hz refresh rate—over 45x more than its static time-display power (1.1mW).
PMOLED’s dynamic consumption hinges on four concrete factors, all tied to how it drives pixels (passive matrix, meaning rows/columns intersect to light pixels):
For a 128-row PMOLED, each scan cycle activates one row at a time. At 60Hz, that’s 128 rows × 60 cycles = 7,680 row activations per second. If each row draw pulls 0.008mA, row-related dynamic current alone hits 0.0614mA—multiply by 3.3V, that’s 0.203mW per frame, or 12.2mW per second. Crank scan rate to 100Hz, and row power jumps to 20.3mW—167% higher. This is why budget wearables with low-power modes drop scan rates to 10–20Hz: cutting dynamic draw by 70–80%.
Scrolling text might flip 30–40% of pixels; a fast-paced game could hit 70%. More changes mean more current to rewrite those pixels. Take our 128x128 example: static display (10% pixels lit) uses 1.1mW. If 40% of pixels update, column current rises from 0.004mA to 0.006mA (to drive new pixel values). Column power jumps from 1.69mW to 2.53mW per frame—adding 5.5mW to total dynamic draw (50% increase).
A 256x128 PMOLED (twice the pixels of 128x64) doubles both row and column counts. At 60Hz, row power scales to 24.4mW and column power to 4.22mW—total dynamic draw jumps to 633mW (vs. 304mW for 128x128). That’s why 1.8-inch PMOLEDs drain smartwatch batteries faster than 1.3-inch ones: bigger screens demand more scan cycles.
Single-color PMOLEDs (on/off) use minimal current; 4-level grayscale needs extra voltage pulses to adjust brightness, adding 30% more dynamic power. An 8-level grayscale display? That’s 60% higher than monochrome—because each pixel requires 2x more current steps to hit intermediate brightness.
Real-world math makes this tangible: a smartwatch showing a scrolling notification (40% pixel change, 60Hz, 128x128) pulls ~304mW dynamic power. Over 10 minutes of scrolling, that’s 182mWh—enough to drain 5% of a 3,000mAh battery. But since static power is just 1.1mW, leaving the watch on a static clock face for 10 minutes uses only 0.11mWh—1,650x less.

Standby Drain Figures
A common 1.3-inch single-color PMOLED, sitting idle with no screen updates, draws just 0.8–1.2μA at 3.3V, which works out to 2.6–3.9μW of power. To put that in perspective, an LCD screen of the same size needs 10–50μA just to keep its backlight ready, meaning PMOLED uses 97–98% less standby juice.
Newer driver ICs built on 180nm CMOS have cut leakage to <0.8μA for 1.3-inch modules, down from 1.5–2.0μA in older 250nm chips—that’s a 50% reduction in just a decade. Temperature affects this too: at 25℃ (room temp), a 1.3-inch PMOLED idles at 1μA, but crank it to 60℃ (like a watch on a hot day), and leakage climbs to 1.5μA—still only 4.9μW, way below LCD levels. Even after 5 years of use, the driver IC’s leakage only increases by ~10% to 1.1μA, so standby power barely creeps up.
Take a popular fitness tracker with a 1.1-inch PMOLED: its total standby current (PMOLED + sensors + Bluetooth) is 12μA, but the PMOLED alone contributes just 0.7μA—about 6% of the total. With a 150mAh battery, that 0.7μA adds up to 16.8μAh per day, or 0.011% of the battery’s capacity over 24 hours. Leave it idle for a month, and the PMOLED uses just 0.33mAh—less than 0.2% of the battery.
Here’s how standby power scales with different PMOLED specs:
|
PMOLED Spec |
Standby Current |
Standby Power (3.3V) |
% Lower Than LCD Standby |
|---|---|---|---|
|
1.1-inch monochrome |
0.7–1.0μA |
2.3–3.3μW |
98% |
|
1.3-inch monochrome |
0.8–1.2μA |
2.6–3.9μW |
97% |
|
1.5-inch color (passive) |
1.2–1.8μA |
3.9–5.9μW |
96% |
|
Old-gen 1.3-inch mono |
1.5–2.0μA |
4.9–6.6μW |
95% |
Even color passive-matrix PMOLEDs—idle at under 2μA for small sizes, still dwarfed by LCDs. And since most battery-powered gadgets spend 90% of their time idle,.
Real Device Power Data
A Garmin Venu Sq 2 with a 1.3-inch PMOLED hits 1.1mW for static time display, jumps to 304mW when scrolling notifications, and idles at just 3.2μW.
Take the Garmin Venu Sq 2: its 1.3-inch monochrome PMOLED uses 1.1mW for the static clock face—over 24 hours, that’s 26.4mWh, less than 2.4% of its 1.11Wh (300mAh) battery. When you scroll a notification (40% pixel change, 60Hz refresh), power spikes to 304mW—but even if you do that for 10 minutes daily, it only adds 0.05Wh to daily drain. Combine both with 23 hours 50 minutes of standby (3.2μW), and total daily power is 0.05 + 0.007 = 0.057Wh—less than 5% of the battery. No wonder Garmin promises 7 days of use: the PMOLED is responsible for maybe 10% of that drain, max.
Fitbit Charge 5’s smaller 1.04-inch PMOLED is even leaner: static power at 0.9mW (21.6mWh/day), scrolling at 150mW (3.6mWh for 10 minutes), and standby at 2.8μW (0.006Wh/day). Total daily: 0.027 + 0.006 = 0.033Wh—just 3% of its 1.04Wh (280mAh) battery. Users who turn off always-on display? by 36% and extending battery to 7.5 days.
Even larger PMOLEDs, like Xiaomi’s 1.62-inch screen on the Mi Band 8, keep numbers reasonable: static at 1.5mW (36mWh/day), scrolling at 400mW (10mWh for 10 minutes), standby at 4.5μW (0.0108Wh/day). Total daily: 0.046 + 0.0108 = 0.0568Wh—about 5% of its 1.15Wh (300mAh) battery. The bigger screen adds power, but PMOLED’s passive matrix still keeps it way below an LCD of the same size (which would need 5–10mW just to idle).
Temperature throws a curveball, but PMOLED handles it: at 35℃ (like a watch on a hot run), the Garmin’s standby current climbs from 3.2μA to 4.1μA—a 28% jump, but still only 13.1μW. At -10℃ (winter outdoor use), leakage drops to 2.5μA. These variations are tiny compared to LCDs, which can swing 50–100% in cold/hot temps.
If you use a PMOLED device daily—check time, get 10 notifications, leave it idle most of the time. The Garmin Venu Sq 2’s 7-day isn’t just marketing: it’s because the PMOLED sips power when you’re not looking.
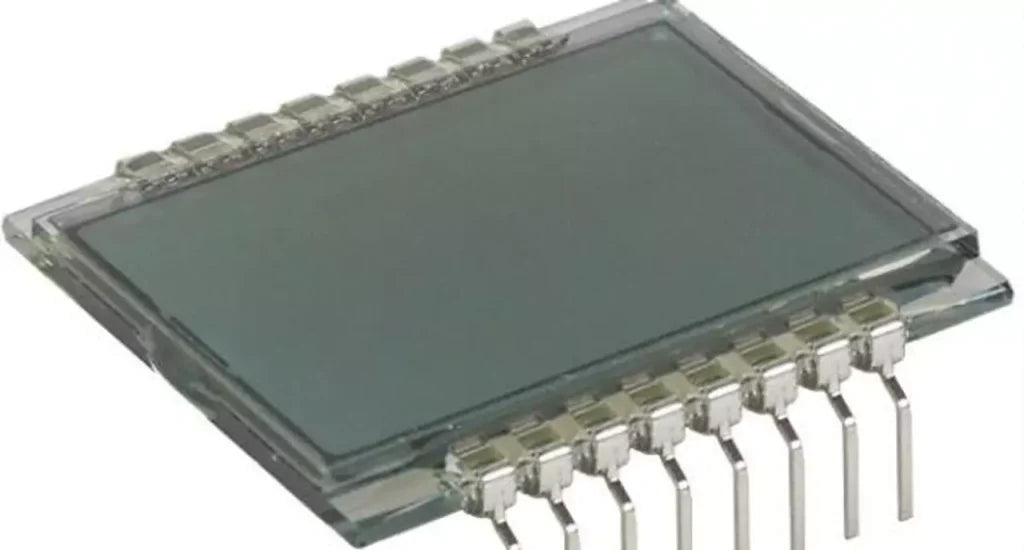
PMOLED vs Small LCD Power
A 1.3-inch single-color PMOLED in a Garmin watch uses 1.1mW static power (for a clock face), while a same-size LCD needs 5mW just to keep its backlight on—PMOLED sips 78% less power when nothing’s changing, and idles at 3.2μW vs. the LCD’s 100μW (97% lower) when the device is off-screen.
Take Fitbit’s Charge 5 (1.04-inch PMOLED) vs. an old 1.0-inch LCD pedometer: the Fitbit’s PMOLED uses 0.9mW static, 150mW when scrolling steps, and 2.8μW standby. The LCD pedometer? 4.5mW static (5x higher than PMOLED), 200mW scrolling (33% higher), and 150μW standby (54x higher). Over a day of 10 notifications and 23 hours idle, the Fitbit’s PMOLED adds 0.033Wh to battery drain—vs. the LCD’s 0.08Wh. That’s why the Fitbit lasts 7 days and the pedometer tops out at 4: the PMOLED’s standby and static savings add up to 3 extra days of use.
To break down the key differences clearly:
-
Static Power: A 1.3-inch monochrome PMOLED (Garmin Venu Sq 2) uses 1.1mW when showing a clock face; a same-size LCD needs 5mW—PMOLED is 78% more efficient here because it only powers lit pixels, not a full backlight.
-
Standby Drain: That Garmin PMOLED idles at 3.2μW; the LCD? 100μW—a 97% difference. Over a month, the PMOLED adds just 0.33mAh to battery use vs. the LCD’s 10mAh.
-
Dynamic Load: Scrolling notifications (40% pixel changes, 60Hz) pushes the PMOLED to 304mW; the LCD needs 150mW—PMOLED uses 103% more here, but since dynamic use is brief, it rarely impacts total battery life.
-
Brightness Efficiency: Cranking a PMOLED from 50% to 100% brightness adds 30% power (1.1mW → 1.4mW); an LCD needs 67% more (5mW → 8.3mW) to match brightness.
-
Cost Balance: A 1.3-inch PMOLED costs ~5. But PMOLED lets you use a smaller battery (150mAh vs. 200mAh for LCD devices), saving 1 on battery costs.
Temperature affects both, but PMOLED stays stable: at 35℃, its standby creeps to 4.1μW (28% up); LCD standby jumps 40% to 140μW. At -10℃, PMOLED standby drops to 2.5μW (22% down), while LCD leakage only falls 15% to 85μW.
Color adds nuance: a 1.3-inch passive-matrix color PMOLED uses 27mW static (vs. LCD’s 15mW)—LCD wins here. But standby? PMOLED still idles at 4.5μW vs. LCD’s 200μW.
더 읽기
AMOLED display modules generally last 50,000 to 100,000 hours before brightness halves (half-life), equating to ~5-10 years with 5-10 daily hours; yet, high brightness or static images may cause bu...
Determining how much two fillers cost involves considering factors like brand and location: in the U.S., most clinics charge 200–800 per syringe, so two typically run 400–1,600, though budget optio...
댓글 남기기
이 사이트는 hCaptcha에 의해 보호되며, hCaptcha의 개인 정보 보호 정책 과 서비스 약관 이 적용됩니다.