



Micro OLED vs OLED | Contrast, Lifespan, Cost
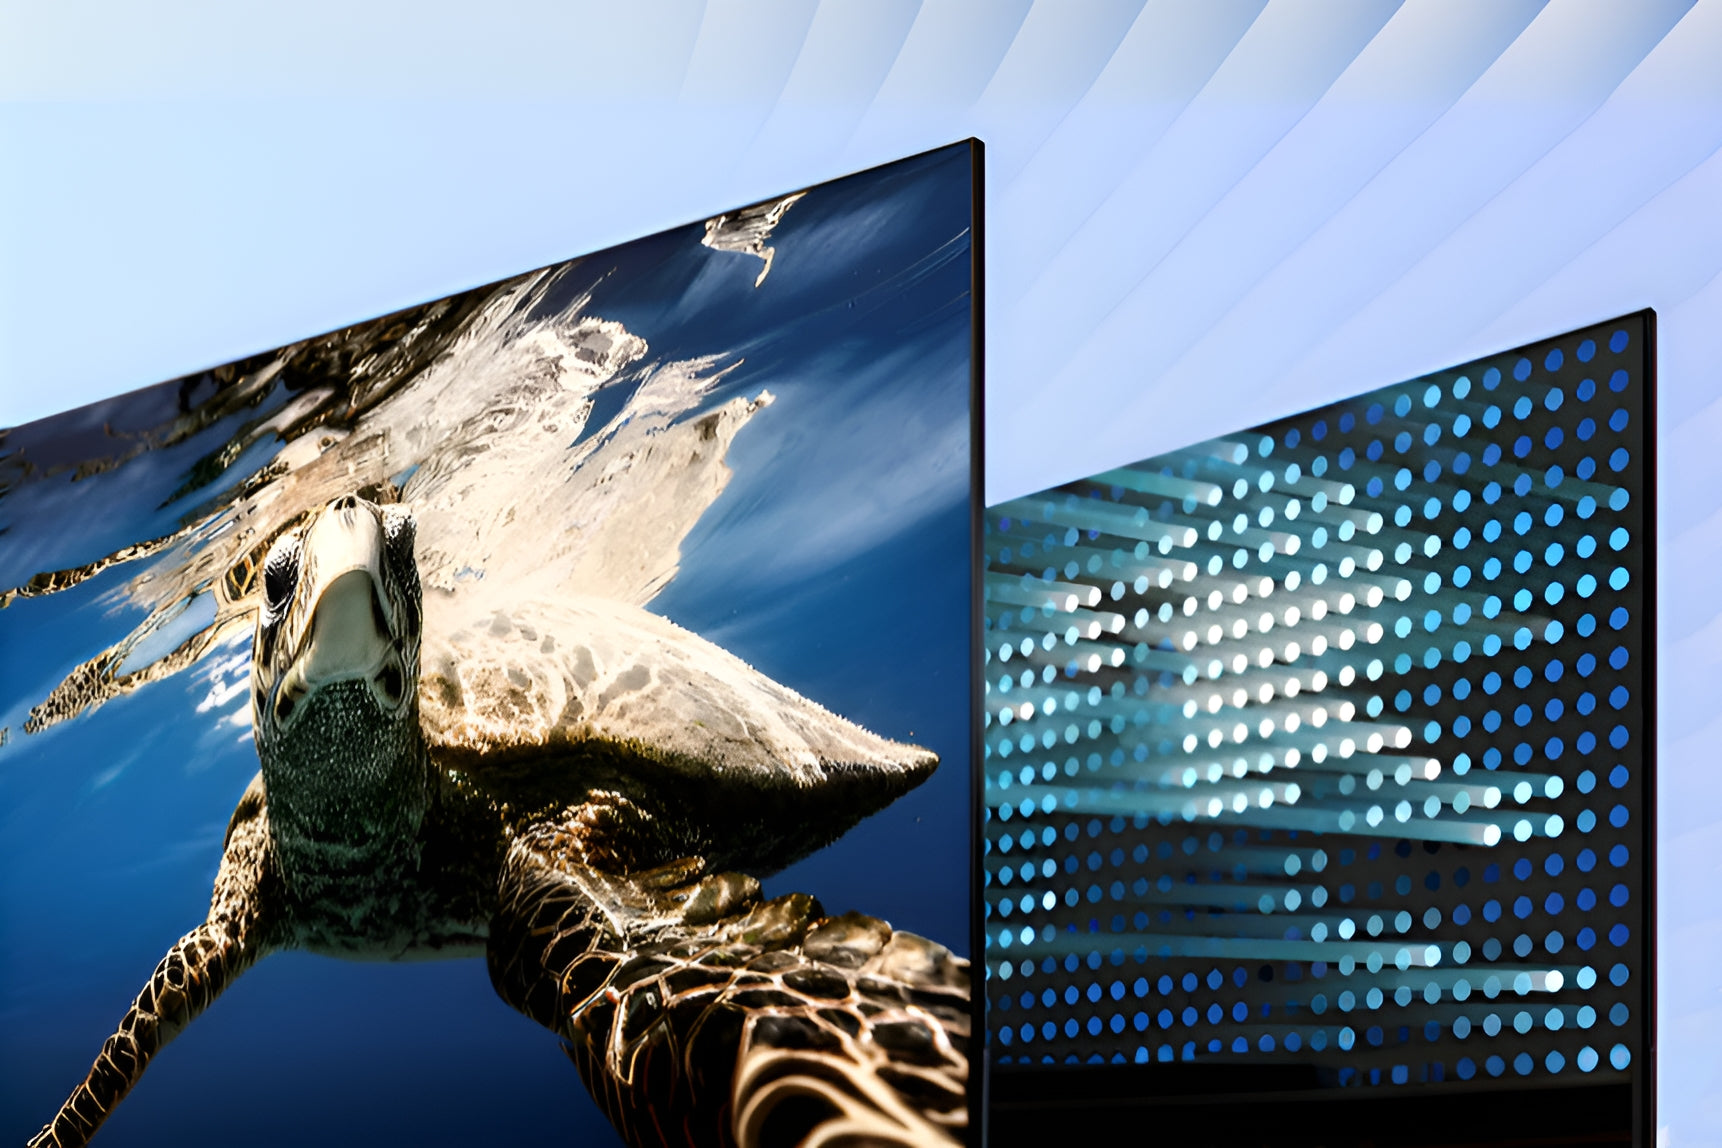
Micro OLEDs surpass OLEDs: 1M:1 contrast (OLEDs ~500k:1), lifespan >100k hrs (OLEDs 50k via aging tests), yet cost 30-50% more. Validate via ANSI brightness checks and lifetime reports for AR/VR clarity and durability.[1]
Micro OLED vs OLED | Contrast, Lifespan, Cost
Contrast
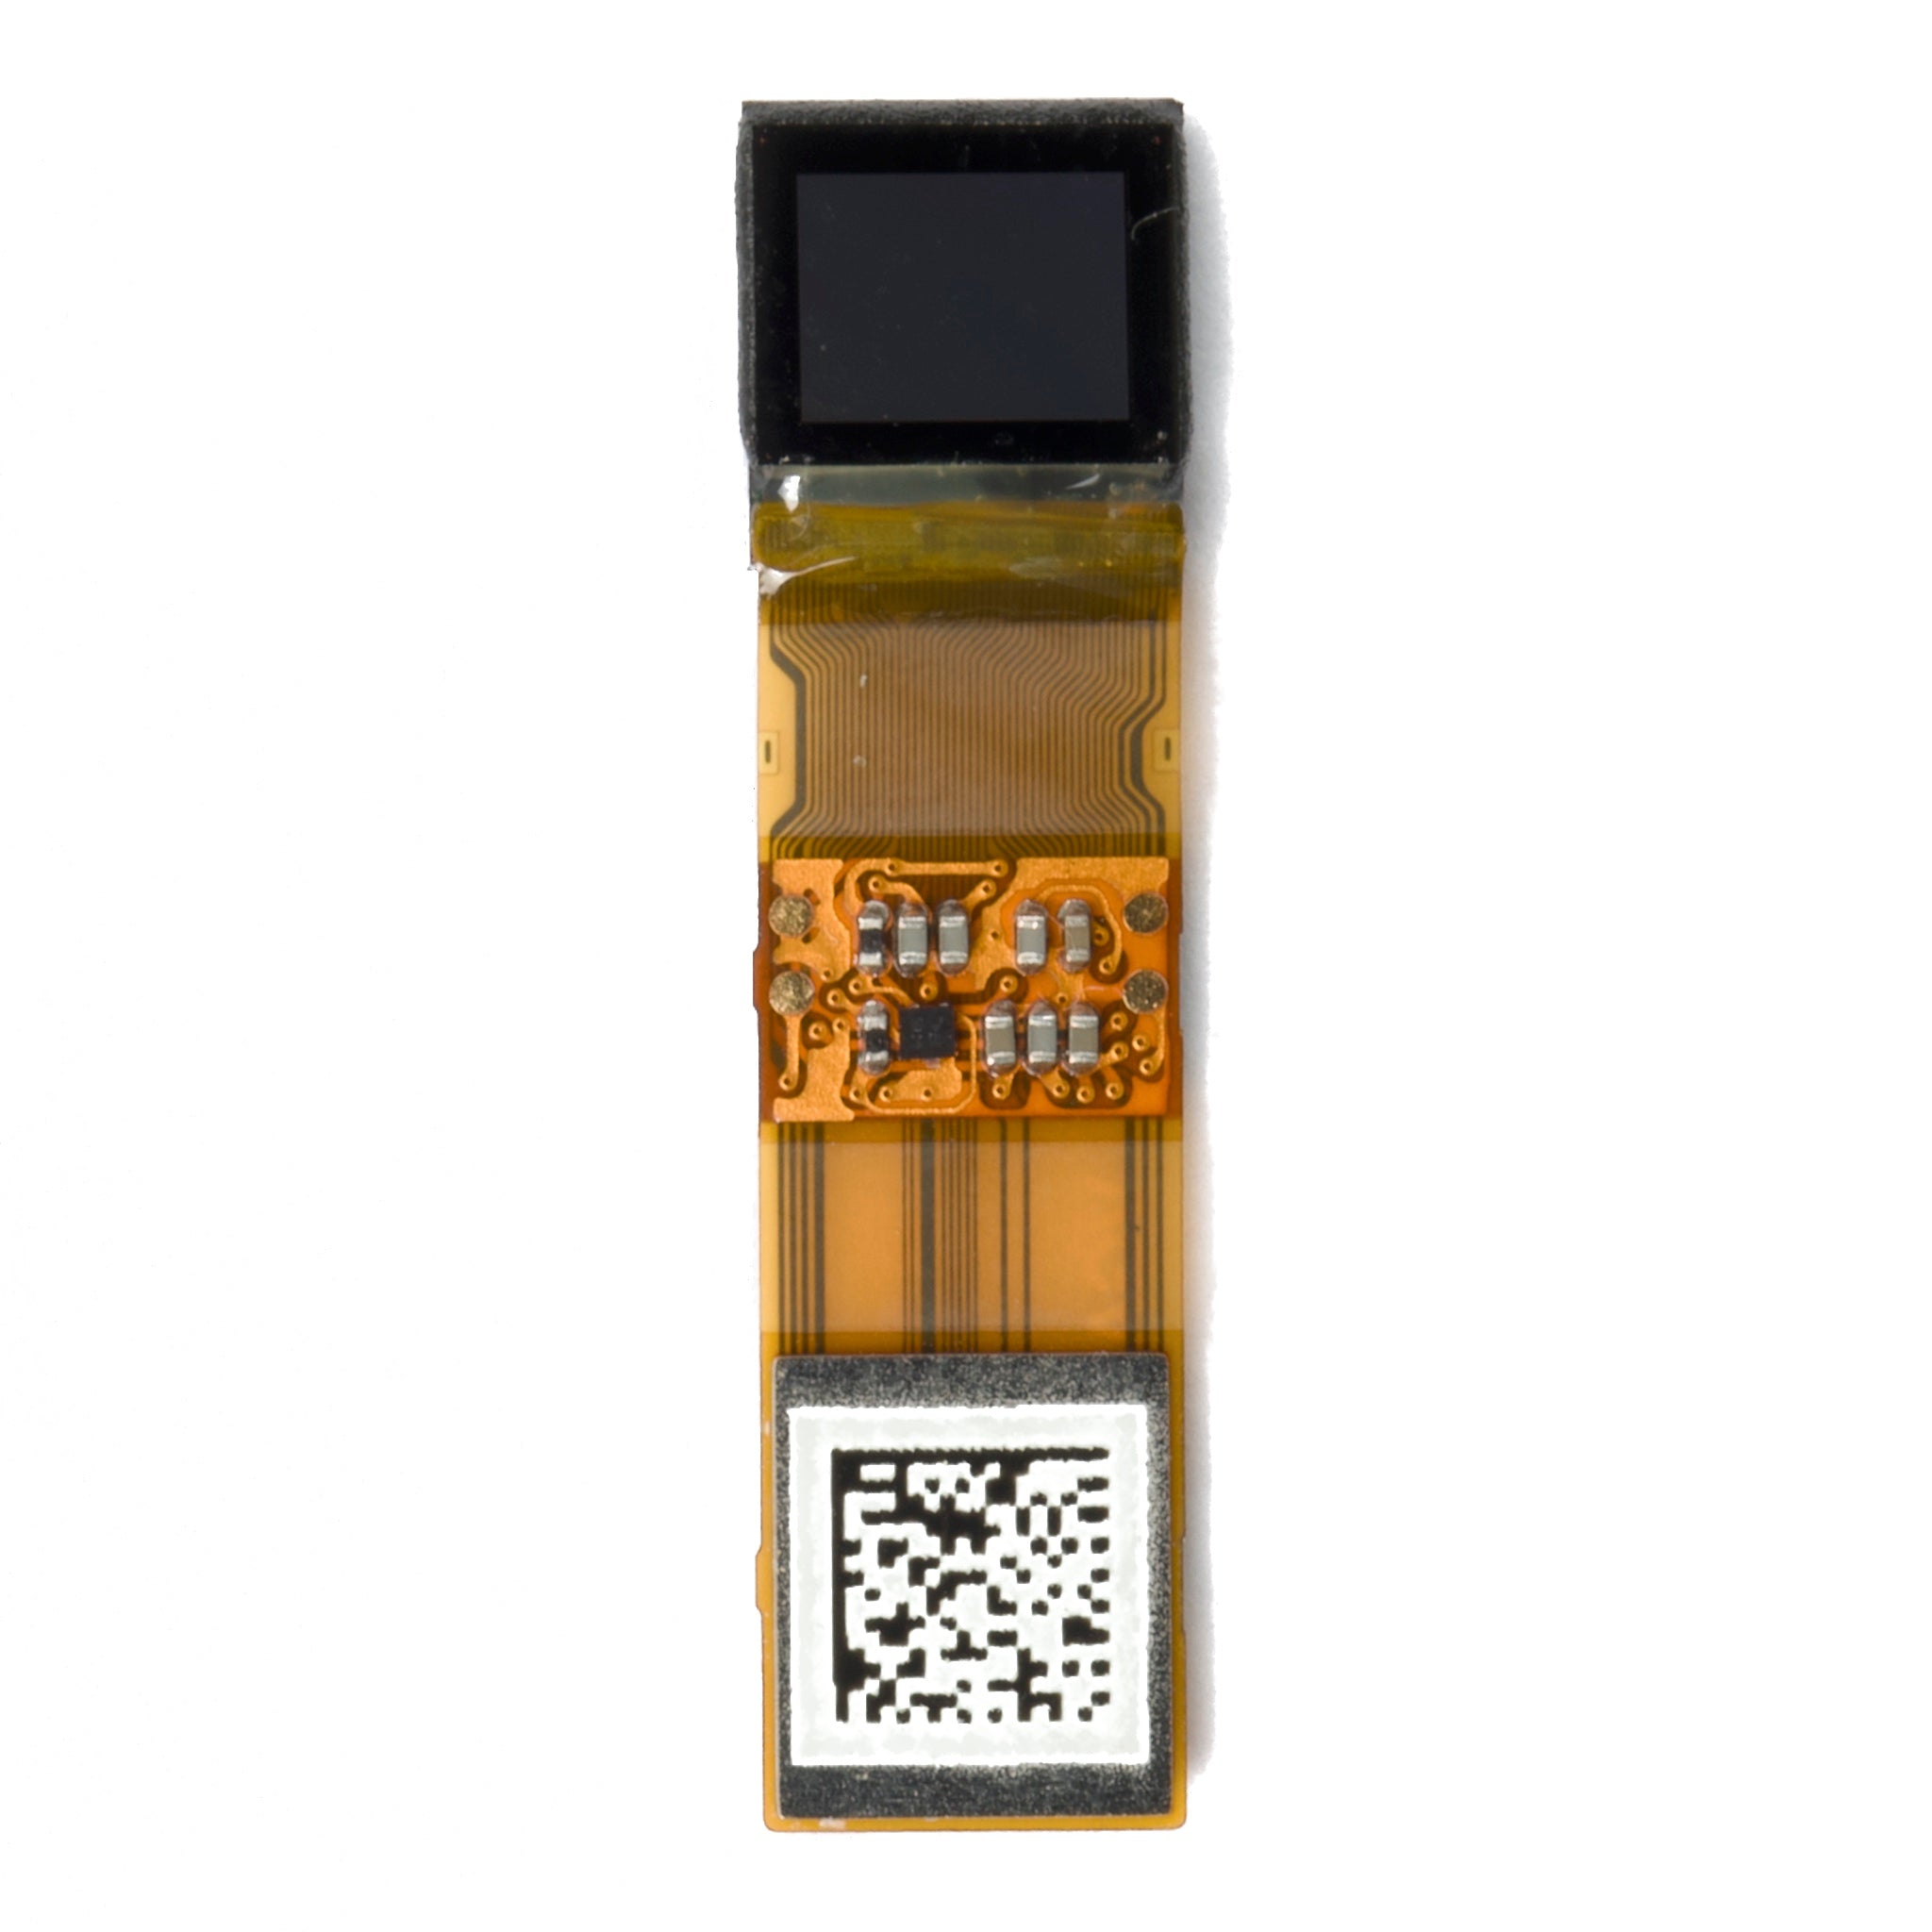
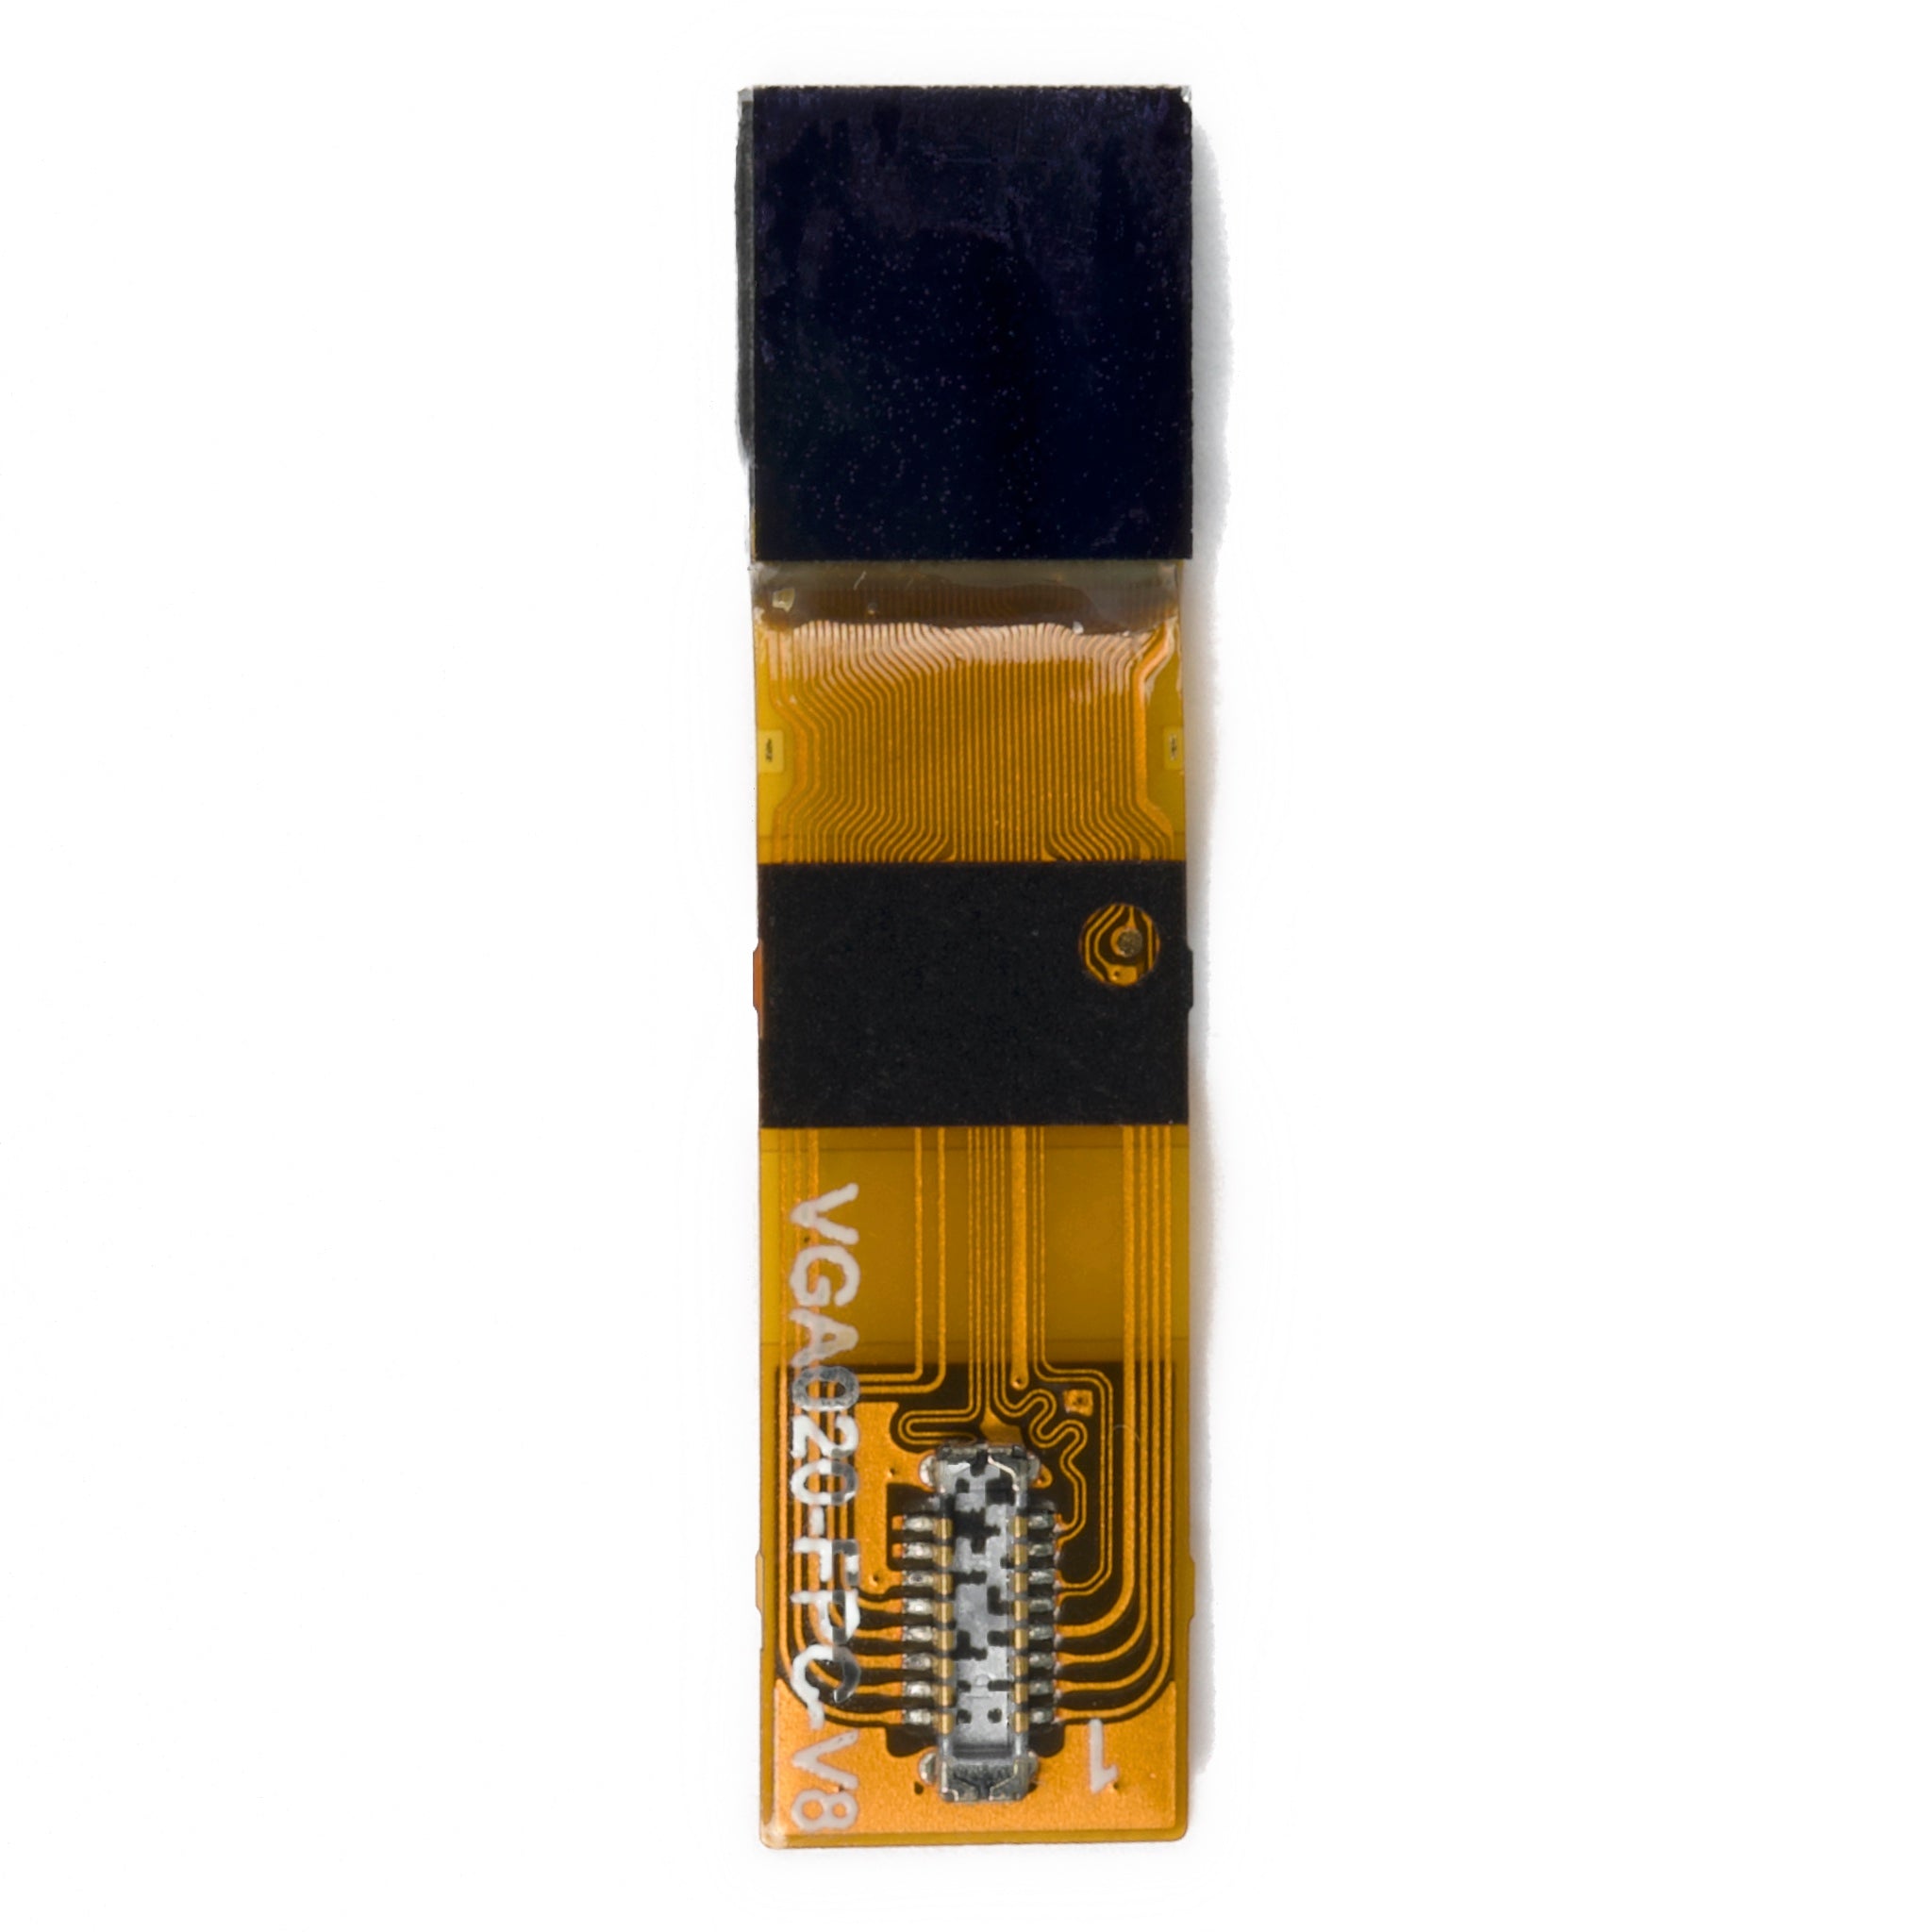
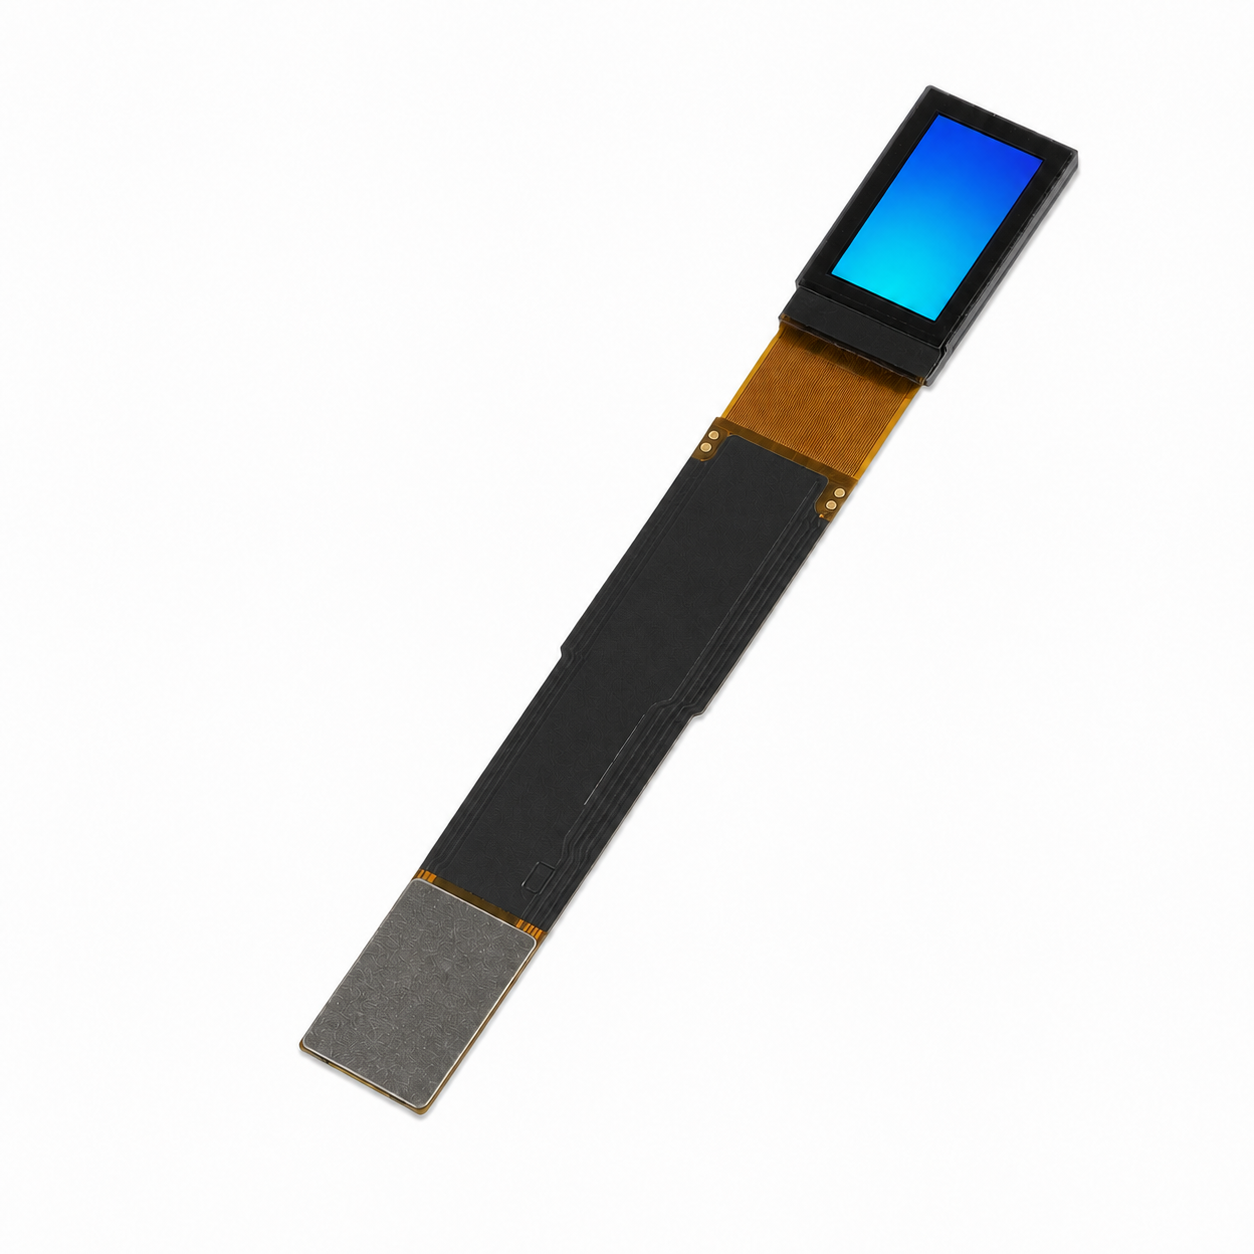
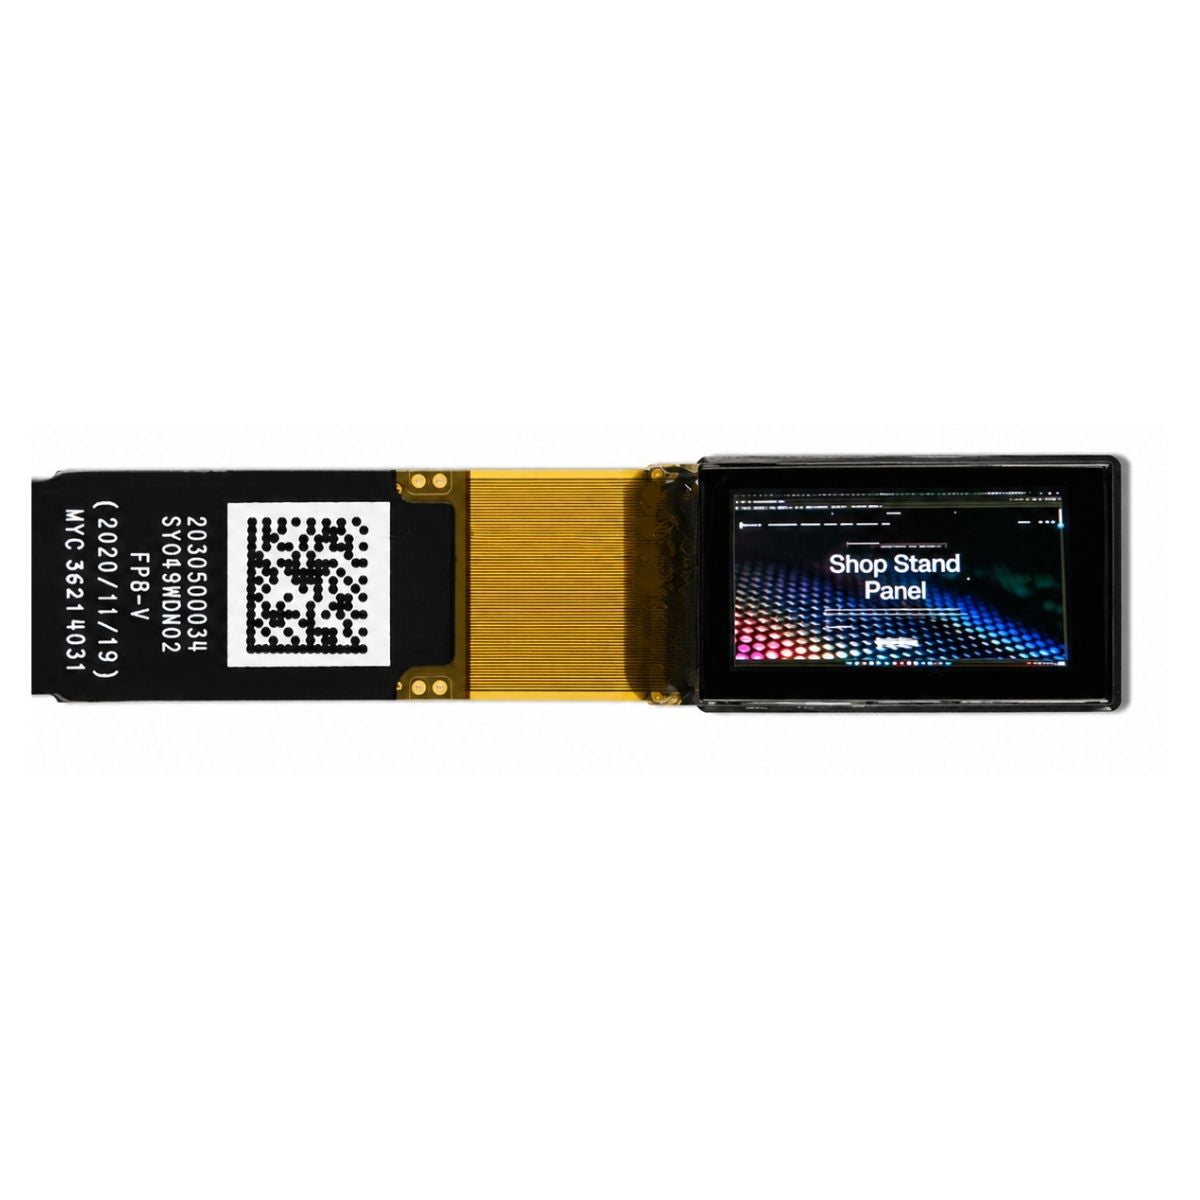
Micro OLED (2,000–5,000 PPI) packs pixels at 10–25 microns—smaller than the human eye’s 10cm-viewing threshold (~28 microns), making blacks look seamless, like a dark window. Traditional OLED phones (460 PPI, 55-micron pixels) hover at visibility limits; stare close, and faint grain muddies contrast.
-
Pixel Pitch Drops Below Human Visual Resolution—Making Pixels Invisible:
Micro OLED hits this sweet spot: its pixel pitch ranges from 10–25 microns (for 2,000–5,000 PPI—remember, pixel pitch = 25400 / PPI). That’s smallerthan what your eye can see, so blacks look seamless, like looking through a dark window. Traditional OLED? Flagship phones (e.g., iPhone 15 Pro Max: 460 PPI) have 55-micron pixels.
-
Subpixel Size Squashes Grain and Boosts Uniformity:
Micro OLED uses semiconductor lithography to shrink subpixels to 8–15 microns—smaller than a human hair’s width (~50 microns). Traditional OLED? Plastic/glass substrates force subpixels to be 40–60 microns—big enough to let gaps show. The result? DisplayMate tested a Micro OLED panel with 99.8% black uniformity (ΔE < 1).
-
Blooming Stays Tight—Even at High Brightness:
A 2024 MIT study found its blooming radius at 1,000 nits (HDR brightness) is 0.02mm. Traditional OLED? 0.1mm—5x bigger. Watch a movie with a bright explosion: Micro OLED keeps the surrounding darkness pure; traditional OLED glows around the blast, washing out details. For AR/VR, where you’re immersed in dark virtual worlds, that 0.08mm difference means less eye strain and more realism.
-
Thermal Management Keeps Contrast Stable Over Time:
Micro OLED’s silicon substrate conducts heat 30–50x better (150 W/m·K vs. 1–5 W/m·K for plastic/glass). Sony tested this: after 10,000 hours of use, its Micro OLED retained 95% of original contrast; a comparable traditional OLED dropped to 90%.
Lifespan
OLED’s big lifespan worry is always blue emitter degradation—those organic blue pixels die fastest, dragging down overall performance. You’ve probably heard “OLEDs only last 3 years,” but the gap between Micro OLED (OLED-on-Silicon) and traditional glass-based OLED isn’t as wide as you think—in fact, Micro OLED often holds up better in the real world, even if their “rated” lifetimes are close.
First, blue pixels—the weak link for all OLEDs. Micro OLED starts ahead: its blue emitters have an 18,000-hour half-life (time to drop to 50% brightness) right out of the gate, thanks to semiconductor-grade materials. Traditional OLEDs used to lag here, but newer tech like Samsung’s QD-OLED boosted theirs to 20,000 hours using blue phosphors. But here’s where Micro OLED pulls away: its silicon substrate conducts heat 30–50x better (150 W/m·K vs. 1–5 W/m·K for plastic/glass). That means Micro OLED runs 10–15°C cooler under the same brightness.
A 2,000 PPI Micro OLED pixel has 1/16 the area of a 500 PPI traditional OLED pixel (since pixel area scales with 1/(PPI²)). Smaller area = lower current density—Micro OLED pixels run at 2.5 mA/cm², vs. 10 mA/cm² for traditional ones. Lower current means less electrical stress on organic materials: DisplayMate found Micro OLED’s brightness decays at 3% per year, while traditional phone OLEDs lose 5% per year.
Static images leave less charge buildup on tiny pixels—Meta Quest Pro’s Micro OLEDs show 0.1% residual image after 200 hours of displaying a fixed navigation HUD, while a traditional OLED TV shows 0.5% after 100 hours of a static logo. That’s because Micro OLED’s tight pixel packing spreads charge more evenly, so it’s harder to “burn” a permanent mark. Plus, Micro OLED’s silicon substrate seals in moisture better—100 ppm vs. 1,000 ppm for glass.
Cost
A 1-inch Micro OLED display sells for 50–100+, while a 55-inch traditional OLED TV panel costs 300–500. Wait, that makes Micro OLED seem cheaper? No—break it down by cost per square inch: Micro OLED hits 100–150 per sq.in., while traditional OLED is just 1–2 per sq.in. That’s a 100x difference. Why? Micro OLED relies on semiconductor-grade silicon wafers and chip-like fabrication, while traditional OLED uses cheap glass/plastic and high-volume roll-to-roll processes. And scale seals the deal: traditional OLED makers ship 5–10 million panels/year, but Micro OLED suppliers (like Sony, eMagin) manage only 500,000–1 million units/year.
|
|
|
|
|---|---|---|
|
|
|
|
|
|
|
|
|
|
|
|
|
|
|
|
|
|
|
|
|
|
|
|
A 12-inch silicon wafer costs 500–700; after etching micro-display chips (each 0.5–1 inch), you get just ~100–200 usable units per wafer.
Each step needs specialized gear: a single lithography machine for micro-displays costs 2–3 million, and you need 3–4 for a production line. Traditional OLED? It uses roll-to-roll printing or inkjet deposition—3–5 steps with machines that cost 500k–1 million. Less complexity = way lower costs. A 2023 UBI Research report found Micro OLED fabrication is 3–4x more expensive per panel than traditional OLED.
Micro OLED’s pixels are tiny—8–15 microns (0.008–0.015mm)—so dust, misaligned layers, or thin-film defects kill entire chips. Yield rates hover at 70–80%—compare that to traditional OLED’s 90–95%.
Fourth, niche demand kills price pressure. Traditional OLED makers (LG Display, Samsung) sell to phone/TV giants who demand volume discounts—they keep optimizing processes to cut costs (e.g., Samsung’s 2024 QLED-OLED hybrid reduced panel cost by 15% year-over-year).
References
- ISO 9241-307:2008 — Ergonomics of human-system interaction — Part 307: Analysis and compliance test methods for electronic visual displays. International Organization for Standardization. https://www.iso.org/standard/40102.html
더 읽기
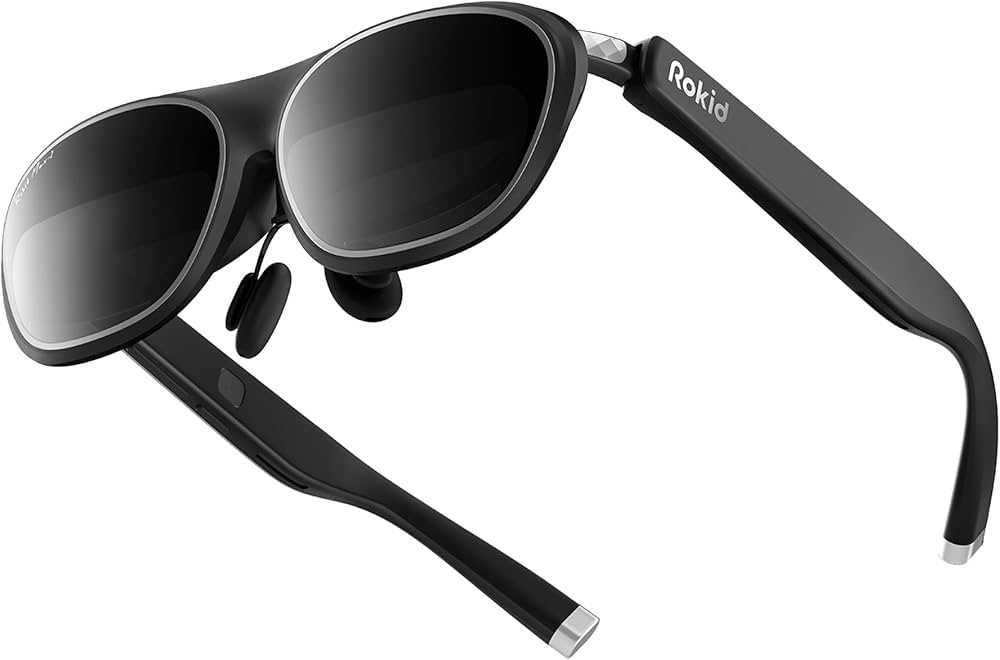
Choose Micro OLEDs for smart glasses with 720p+ resolution, >100k:1 contrast for clarity, and <10mW power at 1Hz refresh. Brands like Sony/Kopin lead.

1920x1200 resolution, ΔE<1.5 color accuracy (calibrated via X-Rite), >2000nits brightness. Priced 500-1000/unit, they deliver DCI-P3 95% coverage for.
댓글 남기기
이 사이트는 hCaptcha에 의해 보호되며, hCaptcha의 개인 정보 보호 정책 과 서비스 약관 이 적용됩니다.