


How are micro OLED displays made
Micro OLED displays are typically produced by depositing organic light-emitting materials onto a small silicon or glass substrate (0.5–1.3 inches) using low-temperature vacuum evaporation at around 80–120°C, followed by encapsulation with ultra-thin barrier films (~5μm thick) to prevent moisture damage, and final assembly involving electrode alignment and basic functionality testing.
Building on a Silicon Backplane
Most micro OLEDs use 8-inch or 12-inch silicon wafers (200mm/300mm diameter), the same base as cutting-edge computer chips, because their 10nm to 20nm feature size precision (achieved through 50+ photolithography steps) lets them fit insanepixel density: think 3,000–5,000 PPI (pixels per inch) in a 0.5-inch panel, which is 5–10x sharper than a flagship smartphone’s 500–800 PPI OLED screen.
This precision starts with the CMOS circuitry: every micro OLED pixel needs its own tiny "driver"—usually 2–3 thin-film transistors (TFTs) and a storage capacitor per sub-pixel—to control brightness and color. These circuits don’t just sit on the silicon; they’re built into it, with transistor channels etched to <50nm width (about 1/1,000th the thickness of a human hair) to squeeze more components into less space. The result? Circuitry takes up <20% of the pixel area in high-end micro OLEDs, leaving 80%+ for light emission—way better than older LCDs where drivers ate up half the space.
Temperature control matters too: while silicon wafers handle high heat during fabrication (900–1100°C during annealing to strengthen the silicon lattice), the final backplane is cooled to 20–30°C before organic layers are added, preventing thermal damage to delicate components. Testing happens early and often: after circuit fabrication, 95% of wafers pass initial checks (like short-circuit tests on TFTs), but only 80–85% survive the full process—including a critical "pixel yield" test where each of the millions of sub-pixels (in a 1-inch panel, that’s ~3 million RGB sub-pixels) must light up uniformly.
Cost-wise, the silicon backplane accounts for 40–50% of a micro OLED’s total production cost—more than the organic materials or encapsulation—because high-PPI wafers are expensive (1,000 per 8-inch wafer, compared to 100 for LCD glass). But it pays off: the same backplane can drive multiple micro OLEDs if yield is high, and its long-term stability (tested for 10,000+ hours of continuous operation without burn-in) justifies the upfront expense for AR/VR headsets or high-end wearables where image quality is non-negotiable.
Depositing Tiny Organic Layers
First, the setup: organic materials (think 8–12 different compounds per display, like aluminum quinolinolate (Alq3) for green or iridium complexes for red) are loaded into ultra-clean, high-vacuum chambers (pressure: 50–100×10^-6 Torr—that’s 1/100,000th of atmospheric pressure) to keep dust or oxygen from ruining the layers. The silicon backplane sits on a heated stage (typically 80–120°C) to ensure the organic molecules stick evenly—too cold, and they clump; too hot, and they degrade.
Now, the deposition itself: most micro OLEDs use thermal evaporation (not sputtering or inkjet printing, which is common in larger OLEDs) because it’s the only way to get layers ultra-thin(total thickness: 50–200nm, about 1/200th the width of a human hair) and uniform(layer thickness variation: <±2% across a 0.5-inch panel). For each sub-pixel (red, green, blue), you need 3–5 layers: a hole injection layer (HIL), hole transport layer (HTL), emissive layer (EML), electron transport layer (ETL), and sometimes an electron injection layer (EIL). Each layer is deposited one after another, with the chamber re-evacuated between some steps to maintain vacuum purity.
Speed matters for cost: thermal evaporation rates are slow—0.05–0.2nm per second (compare that to spray coating at 100s of nm per second)—but necessary for quality. A full set of organic layers (5 layers) on an 8-inch wafer takes ~45 minutes per wafer, and since each wafer holds 50–100 micro OLED panels (0.5–1.3 inches), that’s 1–2 hours per batch just for organic deposition. Material waste is a big factor too: only 30–40% of the evaporated organic molecules end up on the substrate; the rest condenses on chamber walls or shields, driving up material costs (organic materials alone cost 100 per wafer).
Quality checks happen mid-process: after depositing the EML (the layer that actually emits light), engineers use UV-Vis spectroscopy to measure layer thickness (target: 100±2nm) and photoluminescence (PL) intensity to confirm emission efficiency (minimum 500 cd/m² at 10mA/cm² drive current). If a layer is too thick (>102nm), it can block lower layers, reducing brightness; too thin (<98nm), and it risks short circuits between electrodes.
|
Key Parameter |
Typical Value/Range |
Impact on Display Performance |
|---|---|---|
|
Vacuum Pressure |
50–100×10⁻⁶ Torr |
Lower pressure = fewer impurities = longer lifespan |
|
Deposition Rate |
0.05–0.2nm/s |
Slower rate = thicker, more uniform layers |
|
Layer Thickness (Total) |
50–200nm |
Thicker = brighter, but risk of short circuits |
|
Organic Material Waste |
60–70% |
Higher waste = higher production cost |
|
EML Emission Efficiency |
≥500 cd/m² (at 10mA/cm²) |
Lower efficiency = dimmer display |
|
Alignment Tolerance |
<±1μm |
Poor alignment = dead pixels |
Finally, there’s the “stacking” challenge: each organic layer must align perfectly with the underlying circuitry (TFTs) and the overlying cathode (a thin metal layer, usually 100–200nm thick magnesium-silver alloy). Misalignment (tolerance: <±1μm) would cause dead pixels—so the entire process happens on a multi-chamber cluster tool with precision robotic arms moving substrates between evaporation sources (typically 10–20 sources per chamber, each for a specific material).

Sealing the Display from Air
Organic materials in micro OLEDs (like emissive layers or conductive polymers) react with even tiny amounts of water vapor (>100 ppm humidity) or oxygen, causing dark spots, brightness decay, or complete failure within days. Without proper sealing, a display’s lifespan could drop from 10,000+ hours to under 1,000 hours—unacceptable for AR glasses or smartwatches.
The main tools: It uses alternating layers of inorganic materials (like silicon nitride, SiNx, or aluminum oxide, Al₂O₃) and organic spacers (like acrylic or epoxy resins) to block moisture. A typical TFE stack has 5–10 inorganic layers (each 50–200nm thick) and 4–8 organic layers (each 1–3μm thick), totaling 5–10μm in thickness—about the width of a red blood cell. This combo blocks >99.9% of water vapor (water vapor transmission rate, WVTR: <0.1 g/(m²·day) at 38°C/90% RH) and >99% of oxygen (oxygen transmission rate, OTR: <0.5 cm³/(m²·day·atm)).
Here, a glass paste (mixed with 70–80% silica, 10–15% boron oxide, 5–10% metal oxides) is screen-printed around the display edges (line width: 0.1–0.3mm), then heated to 400–500°C for 1–2 hours to melt and bond with the silicon backplane and a cover glass (thickness: 0.5–1.0mm). This creates a hermetic seal with WVTR <0.01 g/(m²·day)—even better than TFE—but adds 0.3–0.5mm to the display’s thickness, making it less flexible.
Speed vs. quality trade-offs: TFE is faster (2–4 hours per wafer) than glass frit (4–6 hours), but glass frit lasts longer in harsh environments. For example, TFE barriers start degrading after 500–1,000 hours of high-humidity testing, while glass frit holds up for 2,000+ hours. Cost-wise, TFE adds 0.15–0.30—a difference that matters for budget wearables.
Quality checks are brutal: after sealing, displays undergo accelerated aging tests (85°C/85% RH for 1,000 hours) to simulate 5–10 years of real-world use. Engineers measure WVTR/O2R with MOCON permeation analyzers (accuracy: ±2%) and check for delamination using optical coherence tomography (OCT) (resolution: 1μm). Only 85–90% of sealed displays pass these tests; the rest are reworked (if possible) or scrapped—costing manufacturers $0.05–0.10 per failed unit in lost materials.
Fun fact: To fix this, some manufacturers add corner reinforcing dots (tiny blobs of epoxy, 0.05–0.1mm diameter) to reduce stress during thermal cycling (from -20°C to 60°C, 100 cycles). This boosts edge seal lifespan by 30–50%—critical for devices like smartwatches that go from pockets to cold environments.
Assembling and Final Testing
Starting with driver IC bonding: each micro OLED panel (0.5–1.3 inches) needs a tiny driver IC (usually 5–10mm² in size) to control pixel signals. This is done via anisotropic conductive film (ACF)—a mix of 10–20% conductive particles (gold or polymer-coated) and 80–90% insulating resin—pressed between the IC and the silicon backplane. The process happens in a hot press (temperature: 120–150°C, pressure: 2–5MPa) for 10–15 seconds per IC. If the pressure’s too low (<2MPa), the ACF won’t make good contact, causing dead pixels (failure rate: 5–10%); too high (>5MPa), and the fragile silicon backplane might crack (1–2% damage rate). Post-bonding, 98% of ICs must pass electrical tests (e.g., signal integrity checks with oscilloscopes measuring rise time: <10μs) to avoid costly rework.
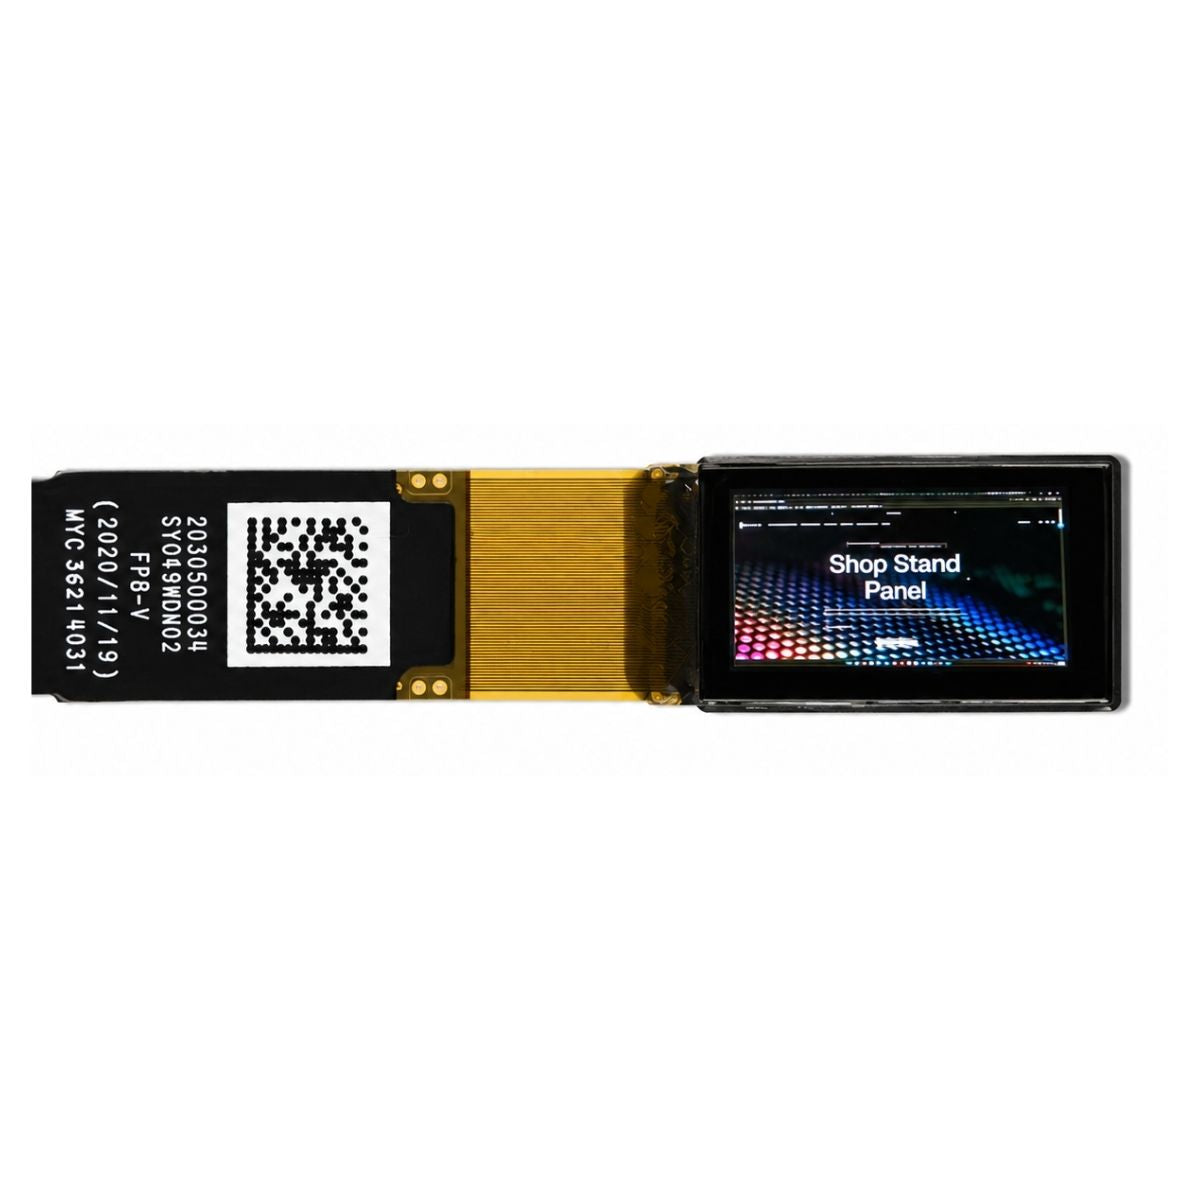
Next, flexible printed circuit (FPC) attachment: most micro OLEDs connect to external controllers via a thin FPC (0.1–0.3mm thick, made of polyimide film with copper traces 5–10μm wide). The FPC is aligned to the panel’s bond pads (pitch: 50–100μm) using UV-curable adhesive (thickness: 10–20μm), then cured under UV light (365nm wavelength, intensity: 500–1,000 mW/cm²) for 30–60 seconds. Misalignment beyond ±5μm causes open circuits, so manufacturers use CCD cameras (resolution: 1μm/pixel) for real-time alignment checks. Only 95–97% of FPC attachments pass this step; the rest require re-bonding, adding $0.02–0.05 per panel to labor costs.
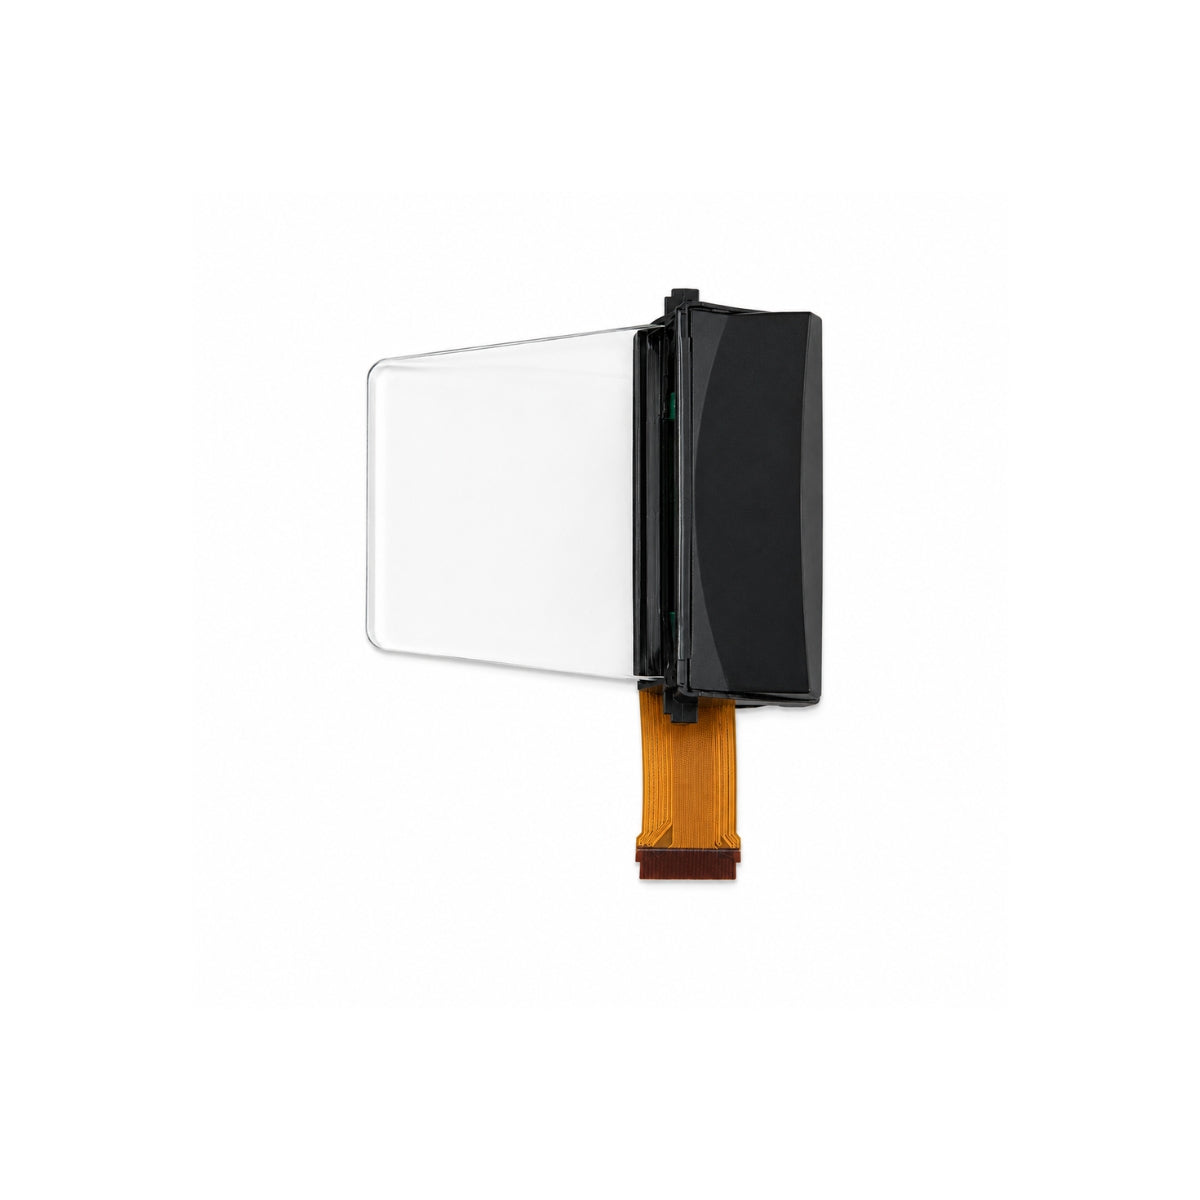
For enclosure assembly (if the display needs a protective case), manufacturers use optically clear adhesive (OCA) (0.05–0.1mm thick, transmittance: >98%) to bond the panel to a glass or plastic cover. The OCA is applied with a precision dispenser (dot size: 0.1–0.3mm) to avoid bubbles—any bubble larger than 0.05mm is rejected (3–5% of units fail this check). The final assembly is left to cure for 24–48 hours at 25–30°C to ensure full adhesion strength (≥5N/cm).
First, optical performance: brightness is measured with a spectroradiometer (accuracy: ±1%)—center brightness must hit ≥300 cd/m² (for AR glasses) or ≥500 cd/m² (for VR), with uniformity across the panel (<5% variation). Color accuracy is checked using a colorimeter (delta E <1.0 for sRGB coverage) to ensure colors match the design. Response time (rise/fall) is tested with a high-speed camera (frame rate: 10,000 fps)—specs demand <1ms for smooth motion in gaming headsets.
|
Key Step/Parameter |
Typical Value/Range |
Impact on Final Product |
|---|---|---|
|
Driver IC Bonding Temperature |
120–150°C |
Too low = poor contact; too high = backplane cracks |
|
FPC Alignment Tolerance |
±5μm |
Excess = open circuits |
|
OCA Thickness |
0.05–0.1mm |
Thicker = reduced transparency; thinner = bubble risk |
|
Brightness Uniformity |
<5% variation |
Poor = uneven image quality |
|
Thermal Cycling Survival Rate |
85–90% |
Low = weak adhesion; high = reliable in extreme temps |
|
Final Test Rejection Rate |
10–15% |
High = costly material waste; low = premium quality |
Then, functional reliability: displays undergo thermal cycling (-20°C to 60°C, 100 cycles) to test adhesion and material expansion—only 85–90% survive without delamination. Humidity aging (85°C/85% RH for 1,000 hours) checks for moisture ingress; failures here (usually 5–8%) mean the sealing step was flawed. Mechanical shock (1.5m drop onto concrete, 3 strikes) tests durability for wearables—90–92% must remain fully functional post-drop.
Read more
The two primary types of OLED are PMOLED (Passive Matrix OLED) and AMOLED (Active Matrix OLED); PMOLED uses simple row-column drivers for small screens (common in 1-2 inch smartwatches), while AMOL...
The key differences between mini OLED and OLED lie in pixel size and density: mini OLED features smaller individual pixels (typically ~40-70μm vs. 70-100μm in standard OLED), enabling higher PPI (o...
Leave a comment
This site is protected by hCaptcha and the hCaptcha Privacy Policy and Terms of Service apply.