


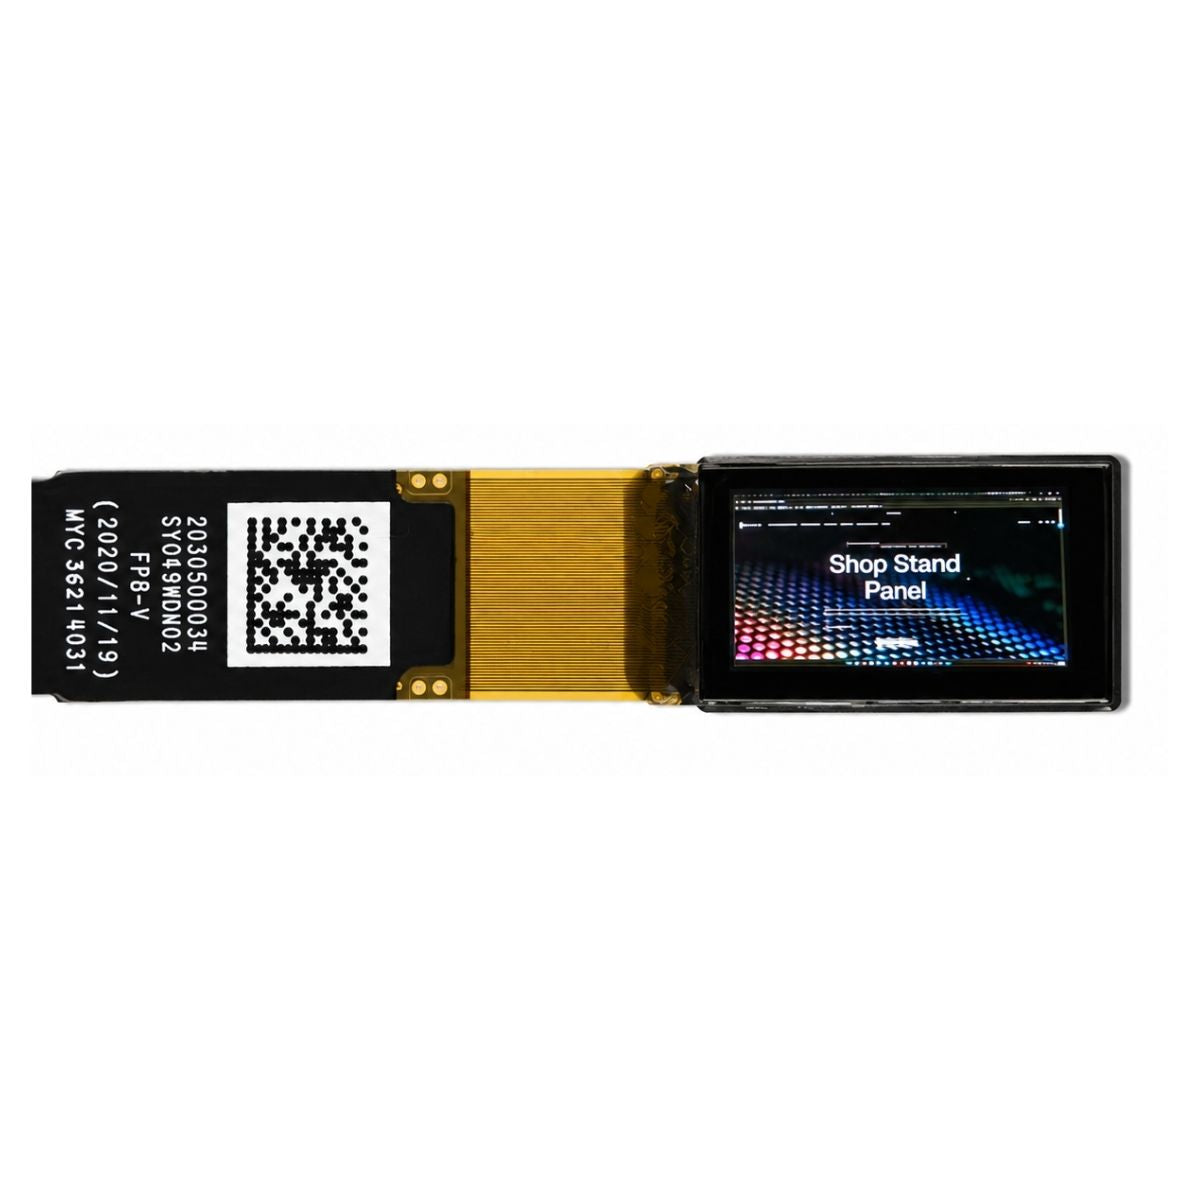


How To Test AMOLED Display Module Quality
To test an AMOLED display module’s quality, start by checking dead pixels in a dark room—aim for fewer than 3 dead pixels per million to avoid noticeable flaws. Use a colorimeter to measure color accuracy, targeting a Delta E value below 2 for true-to-life hues. Finally, verify brightness uniformity; differences between the center and edges should stay under 10%to prevent uneven glow.
Dead Pixel Check
Industry benchmarks like DisplayMate’s Class 1 standardrequire fewer than 3 dead pixels per million for premium modules, while budget models often tolerate up to 5 per million. Use a pitch-black background at 100% brightnessin a 50 lux ambient light room(too bright hides dim dead pixels; too dark strains eyes) to spot them.
To execute a thorough dead pixel check:
Use a dedicated LCD/AMOLED test app(e.g., Dead Pixel Test by Chainfire) that cycles through full black, full red, full green, and full blue screens. Why these colors? AMOLED subpixels (red, green, blue) emit light individually; a dead subpixel will fail to light up on its dedicated color screen (e.g., a dead green subpixel stays dark on the full-green background but looks normal on black).
Set your test environment: dim overhead lights to hit 50 ±10 lux(use a light meter app), position the display 30–50 cm from your eyes(close enough to spot tiny dots, far enough to avoid eye strain), and let the screen run each color for at least 30 seconds.
Document findings with a screenshot or grid overlay: mark each dead pixel’s location (e.g., “Row 12, Column 47 – stuck off, black screen”) and cross-reference with the display’s total pixel count. A 1080p AMOLED (1,920x1,080 pixels ≈ 2 million total subpixels)should have <6 dead subpixelsto meet Class 1. If you find 7+, flag it for return or repair—manufacturers often reject batches exceeding 5 dead pixels per million due to customer return risks (studies show 15% of buyerscite dead pixels as their top display complaint).
Track both types separately: a module with 2 stuck + 4 dead pixelsfails stricter Class 1 checks but might pass budget Class 2 (allowing 8 total).
Use this quick reference table to grade results:
|
Pixel Type |
Test Method |
Acceptable Threshold (Class 1) |
Common Cause |
|---|---|---|---|
|
Stuck On (Bright) |
Black screen |
<3 per million subpixels |
Manufacturing defect |
|
Stuck Off (Dark) |
Color-specific screens |
<3 per million subpixels |
Subpixel circuit failure |
|
Colored Dot |
Red/green/blue screens |
<3 per million subpixels |
Voltage mismatch in RGB cells |
Color Accuracy Test
Premium flagship modules (e.g., Samsung Galaxy S-series or Apple iPhone Pro displays) target Delta E <2(per DisplayMate’s A+ rating), where colors look nearly identical to reality; budget models might settle for Delta E <4, but even that can make skin tones look yellowish or skies appear oversaturated.
To run a meaningful color accuracy test, you need precision tools and controlled conditions:
Start with calibrating your equipment: use a hardware spectrophotometer like X-Rite’s i1Display Pro (software: DisplayCal) to align with a standard IT8.7/3 color chart—this ensures your tester itself has <0.1 Delta E errorbefore measuring the display. Next, set up the environment: mimic natural daylight with a D50 light source(5000K color temperature) at 500 ±50 lux(use a light meter to avoid shadows or reflections), and let the AMOLED screen warm up for 30 minutes—cold panels can skew Delta E by 0.2–0.5 due to slow organic diode activation.
Then, display test patterns: first, cover the full sRGB gamut(100% of its 16.7 million colors) to check basic accuracy—premium modules must keep average Delta E <2here. For wider gamuts like DCI-P3 (used in movies and HDR), test 90% of its 1.07 billion colors; aim for average Delta E <2.5. Don’t skip edge cases: display pure red (RGB 255,0,0), pure green (0,255,0), and pure blue (0,0,255) for 10 minutes each—AMOLED’s organic materials can “drift” at high saturation, increasing Delta E by 0.3–0.7 if the panel is low-quality.
Track three key metrics:
-
Average Delta E: The overall color consistency across all tested colors.
-
Max Delta E: The worst single color deviation.
-
95th Percentile Delta E: The upper limit of what 95% of users will perceive—critical for professional use (e.g., photo editing).
For example, a top-tier AMOLED module tested with 1,000 color samples might yield: average Delta E 1.8, max Delta E 3.2, and 95th percentile 2.1—this hits premium standards. A budget panel could show average Delta E 3.5, max 6.1.
Use this table to grade results against user expectations:
|
Metric |
Premium Target |
Budget Target |
% of Users Who Notice Deviations |
|---|---|---|---|
|
Average Delta E |
<2 |
<4 |
1% (Delta E <3) vs. 15% (Delta E =3) |
|
Max Delta E |
<3.5 |
<6 |
5% (Delta E <5) vs. 40% (Delta E =5) |
|
95th Percentile Delta E |
<2.5 |
<5 |
3% (Delta E <4) vs. 25% (Delta E =4) |
Don’t forget long-term stability: AMOLEDs age over time, causing Delta E to increase by ~0.2 per 6 monthsof heavy use. Test a module after simulating 500 hours of HDR playback (using software like HCFR)—if Delta E jumps to >3, its color accuracy will fade fast, frustrating users who watch a lot of movies.

Brightness Uniformity Check
Flagship modules like Samsung’s Galaxy S24 Ultra hit <8% max deviation(DisplayMate’s A+ rating), meaning edges stay nearly as bright as the center; budget panels often creep to 15–20%, creating an annoying “cloudy” or “dim edge” effect that’s impossible to ignore during movies or games.
Start with a calibrated brightness meter(e.g., Minolta CS-2000 or Konica Minolta LS-100), not a phone app (which can be off by 5–10%). Set up in a 50 ±10 lux room(use a light meter app to avoid shadows) and let the AMOLED warm up for 30 minutes, so initial brightness readings can swing wildly (up to 5% difference in the first 10 minutes).
Next, define your test grid: for a 6.7-inch 1080p AMOLED (2000x1080 pixels), use a 5x5 grid(25 points) covering the center, mid-edges, and four corners.
Calculate two key numbers:
-
Average Brightness: Sum all 25 nits readings and divide by 25—this is your baseline (e.g., 450 nits).
-
Max Deviation: Find the highest and lowest nits readings, then divide the difference by the average.
For example: if the center reads 460 nits, the bottom edge 410 nits, and average is 450 nits, max deviation is ((460-410)/450) × 100 = 11%—too high for premium, but maybe okay for a $150 budget phone.
Don’t skip long-term testing: Simulate 500 hours of HDR playback (using HCFR software) and retest: a good module will keep max deviation <10%, but a low-quality one can jump to 18–20%, making edges look noticeably darker after a year of use.
Here’s how to grade results against real-world user tolerance:
-
Max Deviation (Full Screen): Premium targets <8%—only 2% of users complain if deviation stays below 10%, but 25% will notice (and likely return) if it hits 10%. Budget targets <15%—though 25% of users still complain when deviation reaches 10%, which budget panels often exceed.
-
Corner vs. Center Difference: Premium demands <10%—just 5% of users notice if the corner is within 12% of center brightness, but 35% will complain at 12%. Budget allows <18%—still, 35% of users will notice at 12%, which budget panels frequently miss.
-
Edge-to-Edge Consistency (Midpoints): Premium requires <5%—only 1% of users complain if midpoints stay within 7% of average, but 18% will notice at 7%. Budget sets <10%—yet 18% of users still complain at 7%, a gap budget panels rarely close.
Because even small deviations feel huge to users: a 10% difference means the center is 10% brighter than the edges. Studies show users notice brightness uniformity issues 3x fasterthan dead pixels.
Another detail: Manufacturing tolerances: if the organic layers on the edge are deposited 10% thinner, those subpixels emit 10% less light.
If your test showed Δ<8%, these issues won’t exist. If Δ>15%, you’ll see it instantly, and users will return the module.
Response Time Test
Flagship modules like the Samsung Galaxy S24 or OnePlus 12 hit <1ms GTG(DisplayMate’s A+ rating), eliminating blur in fast-paced games; budget panels often lag at 3–5ms GTG, making scrolling or action scenes look “smudged” (studies show users notice blur at ≥2ms GTG).
Start with a calibrated color analyzer(e.g., X-Rite i1Display Pro paired with DisplayCal) or an AMOLED-specific tool like TestUFO. Set the room to 25 ±2℃—cold temperatures slow organic diode response by 10–15%, so testing in a chilly space gives fake “slow” readings. Warm up the display for 30 minutesfirst: cold AMOLEDs have unstable subpixel activation, causing 0.5ms variance in early tests.
Next, run dynamic patterns: use software to generate 256-level gray transitions(10% to 90% gray and back) at 60Hz(standard refresh rate). Record each subpixel’s rise time(dark to bright) and fall time(bright to dark). Test 100 subpixelsacross the screen (center, edges, corners) to catch inconsistencies: budget panels often have edge subpixels that are 2–3ms slowerthan the center.
Calculate three critical metrics:
-
Average GTG: Sum all rise/fall times and divide by test count—this is your overall speed (e.g., 0.9ms for premium, 4.2ms for budget).
-
Max GTG: The slowest single subpixel switch—users notice this as “jitter” in fast motion (like a character running in a game).
-
99th Percentile GTG: The upper limit of what 99% of subpixels achieve—vital for 120Hz/144Hz displays, where every millisecond counts.
For example: a premium module might have average GTG 0.8ms, max 1.2ms, and 99th percentile 1.5ms—flawless for 144Hz gaming. A budget panel could show average 4ms, max 6ms, 99th percentile 7ms—blurry even at 60Hz.
Don’t skip long-term testing: Simulate 500 hours of high-refresh-rate gameplay (using HCFR software) and retest: a good module keeps max GTG <2ms, but a low-quality one jumps to 8–10ms, making motion unwatchable.
Here’s how users perceive different GTG times:
-
<1ms GTG: 99% of users call motion “instant” or “smooth” (no blur/trail).
-
1–2ms GTG: 95% notice no issues.
-
2–3ms GTG: 30% complain about “slight blur” during fast action.
-
≥5ms GTG: 70% find motion “uncomfortable” or “laggy,” especially in 120Hz mode.
A key mistake to avoid: confusing GTG with MPRT(Moving Picture Response Time). Manufacturers often advertise MPRT (“1ms”). A panel with 3ms GTG might claim 1ms MPRT.
Viewing Angle Verification
Viewing angle verification checks how much an AMOLED’s color, brightness, and contrast degrade when viewed off-center—say, 30° to 60° from straight-on. Premium modules like LG’s OLED evo panels keep color deviation (Delta E) <2and brightness drop <15%even at 60°, while budget ones often see Delta E jump to 5+and brightness plummet 30–40%, making images look washed-out or tinted (studies show users notice color shifts at ≥3° off-center).
Set up in a 50 ±10 lux room(dark enough to see subtle changes but not so dark your eyes adapt and mask issues). Warm up the AMOLED for 30 minutes first.
Next, define your test grid: for a 6.7-inch display, rotate it every 5° from 0° (straight-on) to 60°(near edge-of-view). At each angle, measure two things:
-
Brightness (nits): Compare to the center (0°) reading—this tells you how much light “leaks” or fades when viewed sideways.
-
Delta E: Check color accuracy against a reference (e.g., sRGB red at 100% saturation)—this catches tint shifts (e.g., white turning blue or yellow at an angle).
A premium AMOLED might hit 450 nits(center) and Delta E 1.2 at 0°. At 15°: 420 nits (7.8% drop), Delta E 1.5. At 30°: 380 nits (15.5% drop), Delta E 1.8. At 60°: 250 nits (44% drop), Delta E 3.8. Maybe 400 nits (center), 300 nits (15°, 25% drop), 200 nits (30°, 50% drop), Delta E 5.1 at 30°.
Don’t skip user perception data: studies show 70% of peoplenotice brightness drops over 15% at 30°, and 40% spot Delta E shifts over 2 at 45°.
Another key detail: If the red subpixels on the edge are deposited 10% thinner, they’ll emit less light at an angle. Test 10 panels from the same batch: a good batch will have max brightness drop <18% at 60°; a bad one will exceed 40%, meaning inconsistent quality for buyers.
Long-term testing matters too: Simulate 500 hours of video playback and retest angles: a premium panel keeps 60° brightness at 220 nits(49% drop from center), while a budget one drops to 150 nits(62.5% drop).
Here’s how to grade results against what users care about:
-
<15% brightness drop at 30°: 90% of users say the display “looks good from the couch.”
-
15–30% drop at 30°: 50% notice “slightly dim edges” but tolerate it.
-
>30% drop at 30°: 80% complain the picture is “washed-out” when not sitting straight on.
-
Delta E <2 at 45°: 85% don’t see color shifts.
-
Delta E >3 at 45°: 60% think the screen has a “weird tint.”
A common trap: AMOLEDs don’t need to be identical at 60°. A 40% brightness drop at 60° is fine if it’s for a personal device (you rarely view it that way), but a dealbreaker for a family TV.
Read more
You can customize NexPCB display modules—we support adjustments like 1.3-inch to 7-inch sizes, 800x480 pixel resolutions, and interface options (SPI/I2C/RGB); our engineers aid in refining designs,...
Temperature significantly impacts display modules: at -10°C, liquid crystals slow, increasing response time by 5-10msand dimming brightness; above 50°C, LED backlights degrade faster, reducing outp...
Leave a comment
This site is protected by hCaptcha and the hCaptcha Privacy Policy and Terms of Service apply.