


Micro OLED Brightness at the Eye | Panel Nits, Optical Loss and Waveguide Efficiency
A Micro OLED panel can be rated at several thousand candelas per square metre and still produce a much lower luminance when measured through an AR optical system. The difference is not explained by one fixed loss number. It depends on the panel operating point, duty cycle, angular light output, lens design, polarization, combiner type, waveguide coupling, pupil expansion, eye position, ambient light, and the measurement method.
The first step is to use the correct quantity. A nit is one candela per square metre. It is a unit of luminance, not luminous intensity and not illuminance. Panel luminance in cd/m² cannot be compared directly with room light in lux. Lux describes light arriving at a surface. Luminance describes light leaving or appearing to leave a surface in a given direction.
A useful engineering method separates five questions: What luminance does the panel produce under the real drive condition? How much of that light enters the optical path? How is the light spread across angle and eye box? What luminance reaches the nominal eye point? How much contrast remains after ambient light is added? Keeping these questions separate prevents double counting and avoids misleading claims such as “a 20% efficient waveguide always gives 20% of the panel nits.”
All numerical examples below are either published device examples or clearly marked calculations. They are not universal limits. A product decision should use the current panel specification, optical design data, measured waveforms, calibrated photometric results, and the test method agreed for that product.

Panel Brightness
Nits Mean Luminance
Luminance describes how bright a surface appears from a stated direction. The SI unit is candela per square metre, written cd/m². The informal name “nit” means the same unit. A reading of 5,000 nits means 5,000 cd/m² under the measurement conditions used by the supplier.
| Quantity | Unit | What it describes |
|---|---|---|
| Luminous flux | lumen | Total visible light output |
| Luminous intensity | candela | Visible light per solid angle |
| Illuminance | lux | Visible light arriving on a surface |
| Luminance | cd/m² | Directional brightness of a surface or virtual image |
| Radiance | W/(sr·m²) | Directional optical power, resolved by wavelength when needed |
| Retinal illuminance | troland | Luminance multiplied by pupil area under a simplified eye model |
A panel data-sheet value is only meaningful when its test conditions are known. The result can change with the displayed pattern, active image area, color, frame rate, pulse width, drive current, junction temperature, case temperature, viewing angle, optical aperture, meter bandwidth, and warm-up time.
For selection work, record at least the following items beside every brightness number:
- Panel model and revision
- White point or RGB drive state
- Active picture level and test pattern
- Peak or time-averaged luminance
- Duty cycle and frame rate
- Ambient and panel temperature
- Measurement direction and field size
- Meter model, calibration date, and uncertainty
Do not assume that “maximum luminance” means continuous full-white operation. Some products quote an on-state value during a short emission window. Others quote the time-averaged output at a stated duty cycle. Some values apply only to a small white area or a limited operating time. These are different operating points.
Panel luminance also does not describe how well the panel couples into a lens. Two panels can have the same on-axis cd/m² but different angular emission. A more forward-directed panel can send more usable light into a small numerical aperture. A wider emitter may measure well on the panel but waste more light outside the acceptance cone of the collimator.
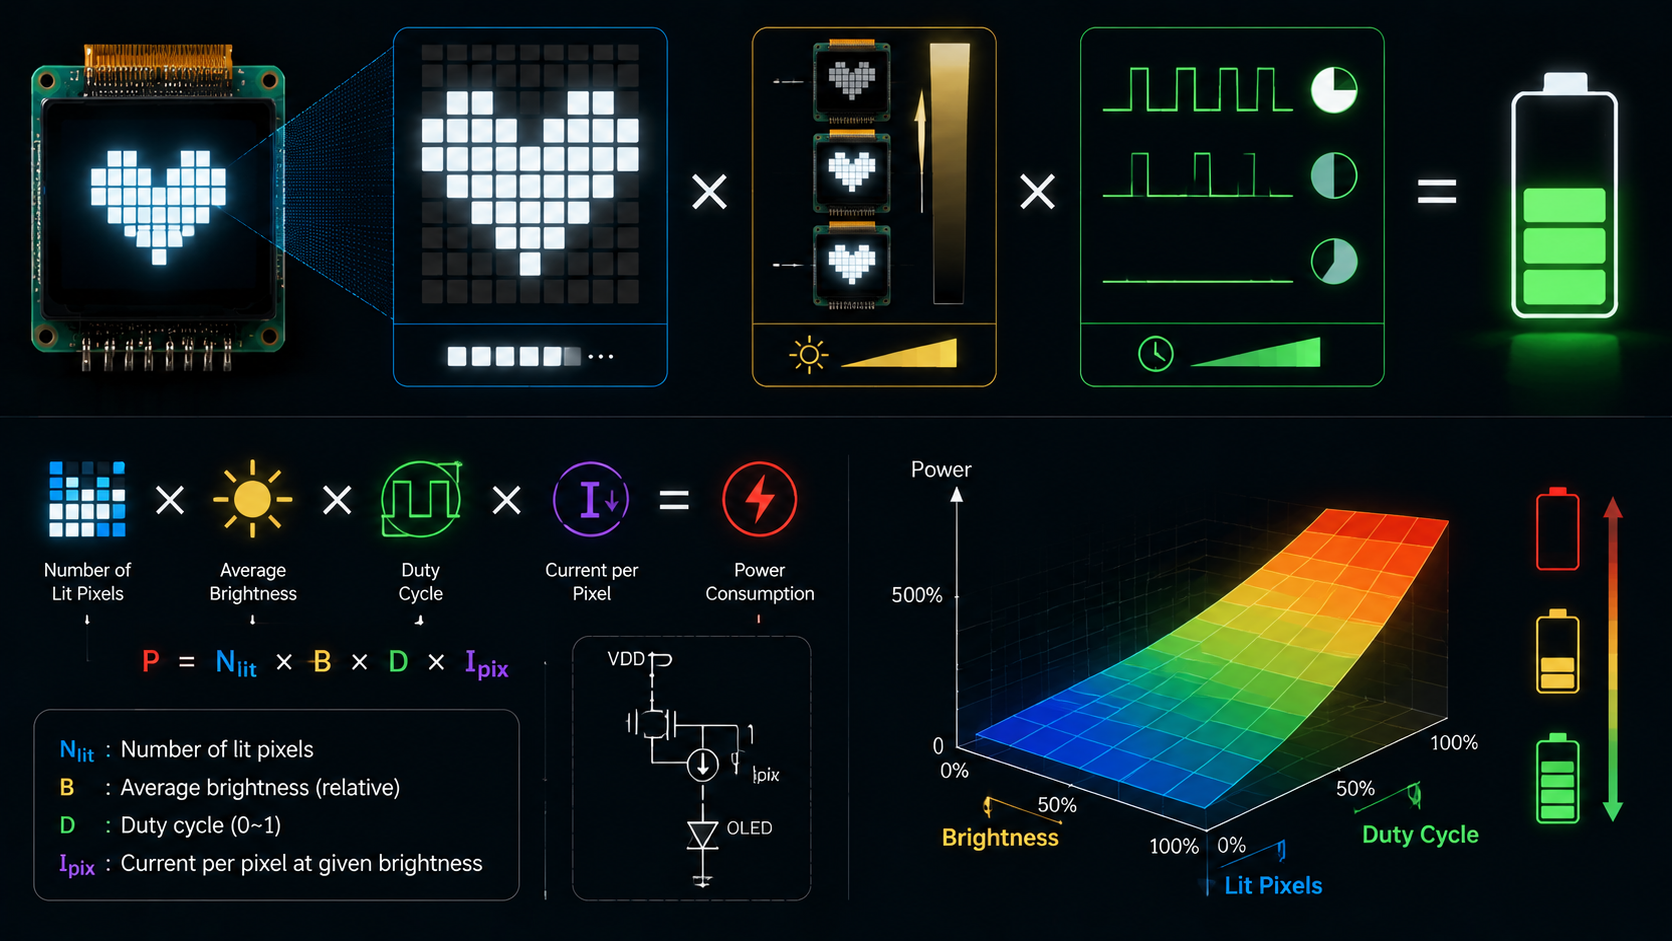
Peak and Duty
Micro OLED systems often use pulsed emission. The panel emits during part of each frame and remains dark during the rest. This can reduce motion blur, but it also changes the relation between on-state luminance and time-averaged luminance.
For a simple rectangular pulse with stable output, the first estimate is:
Average luminance ≈ On-state luminance × Duty cycle
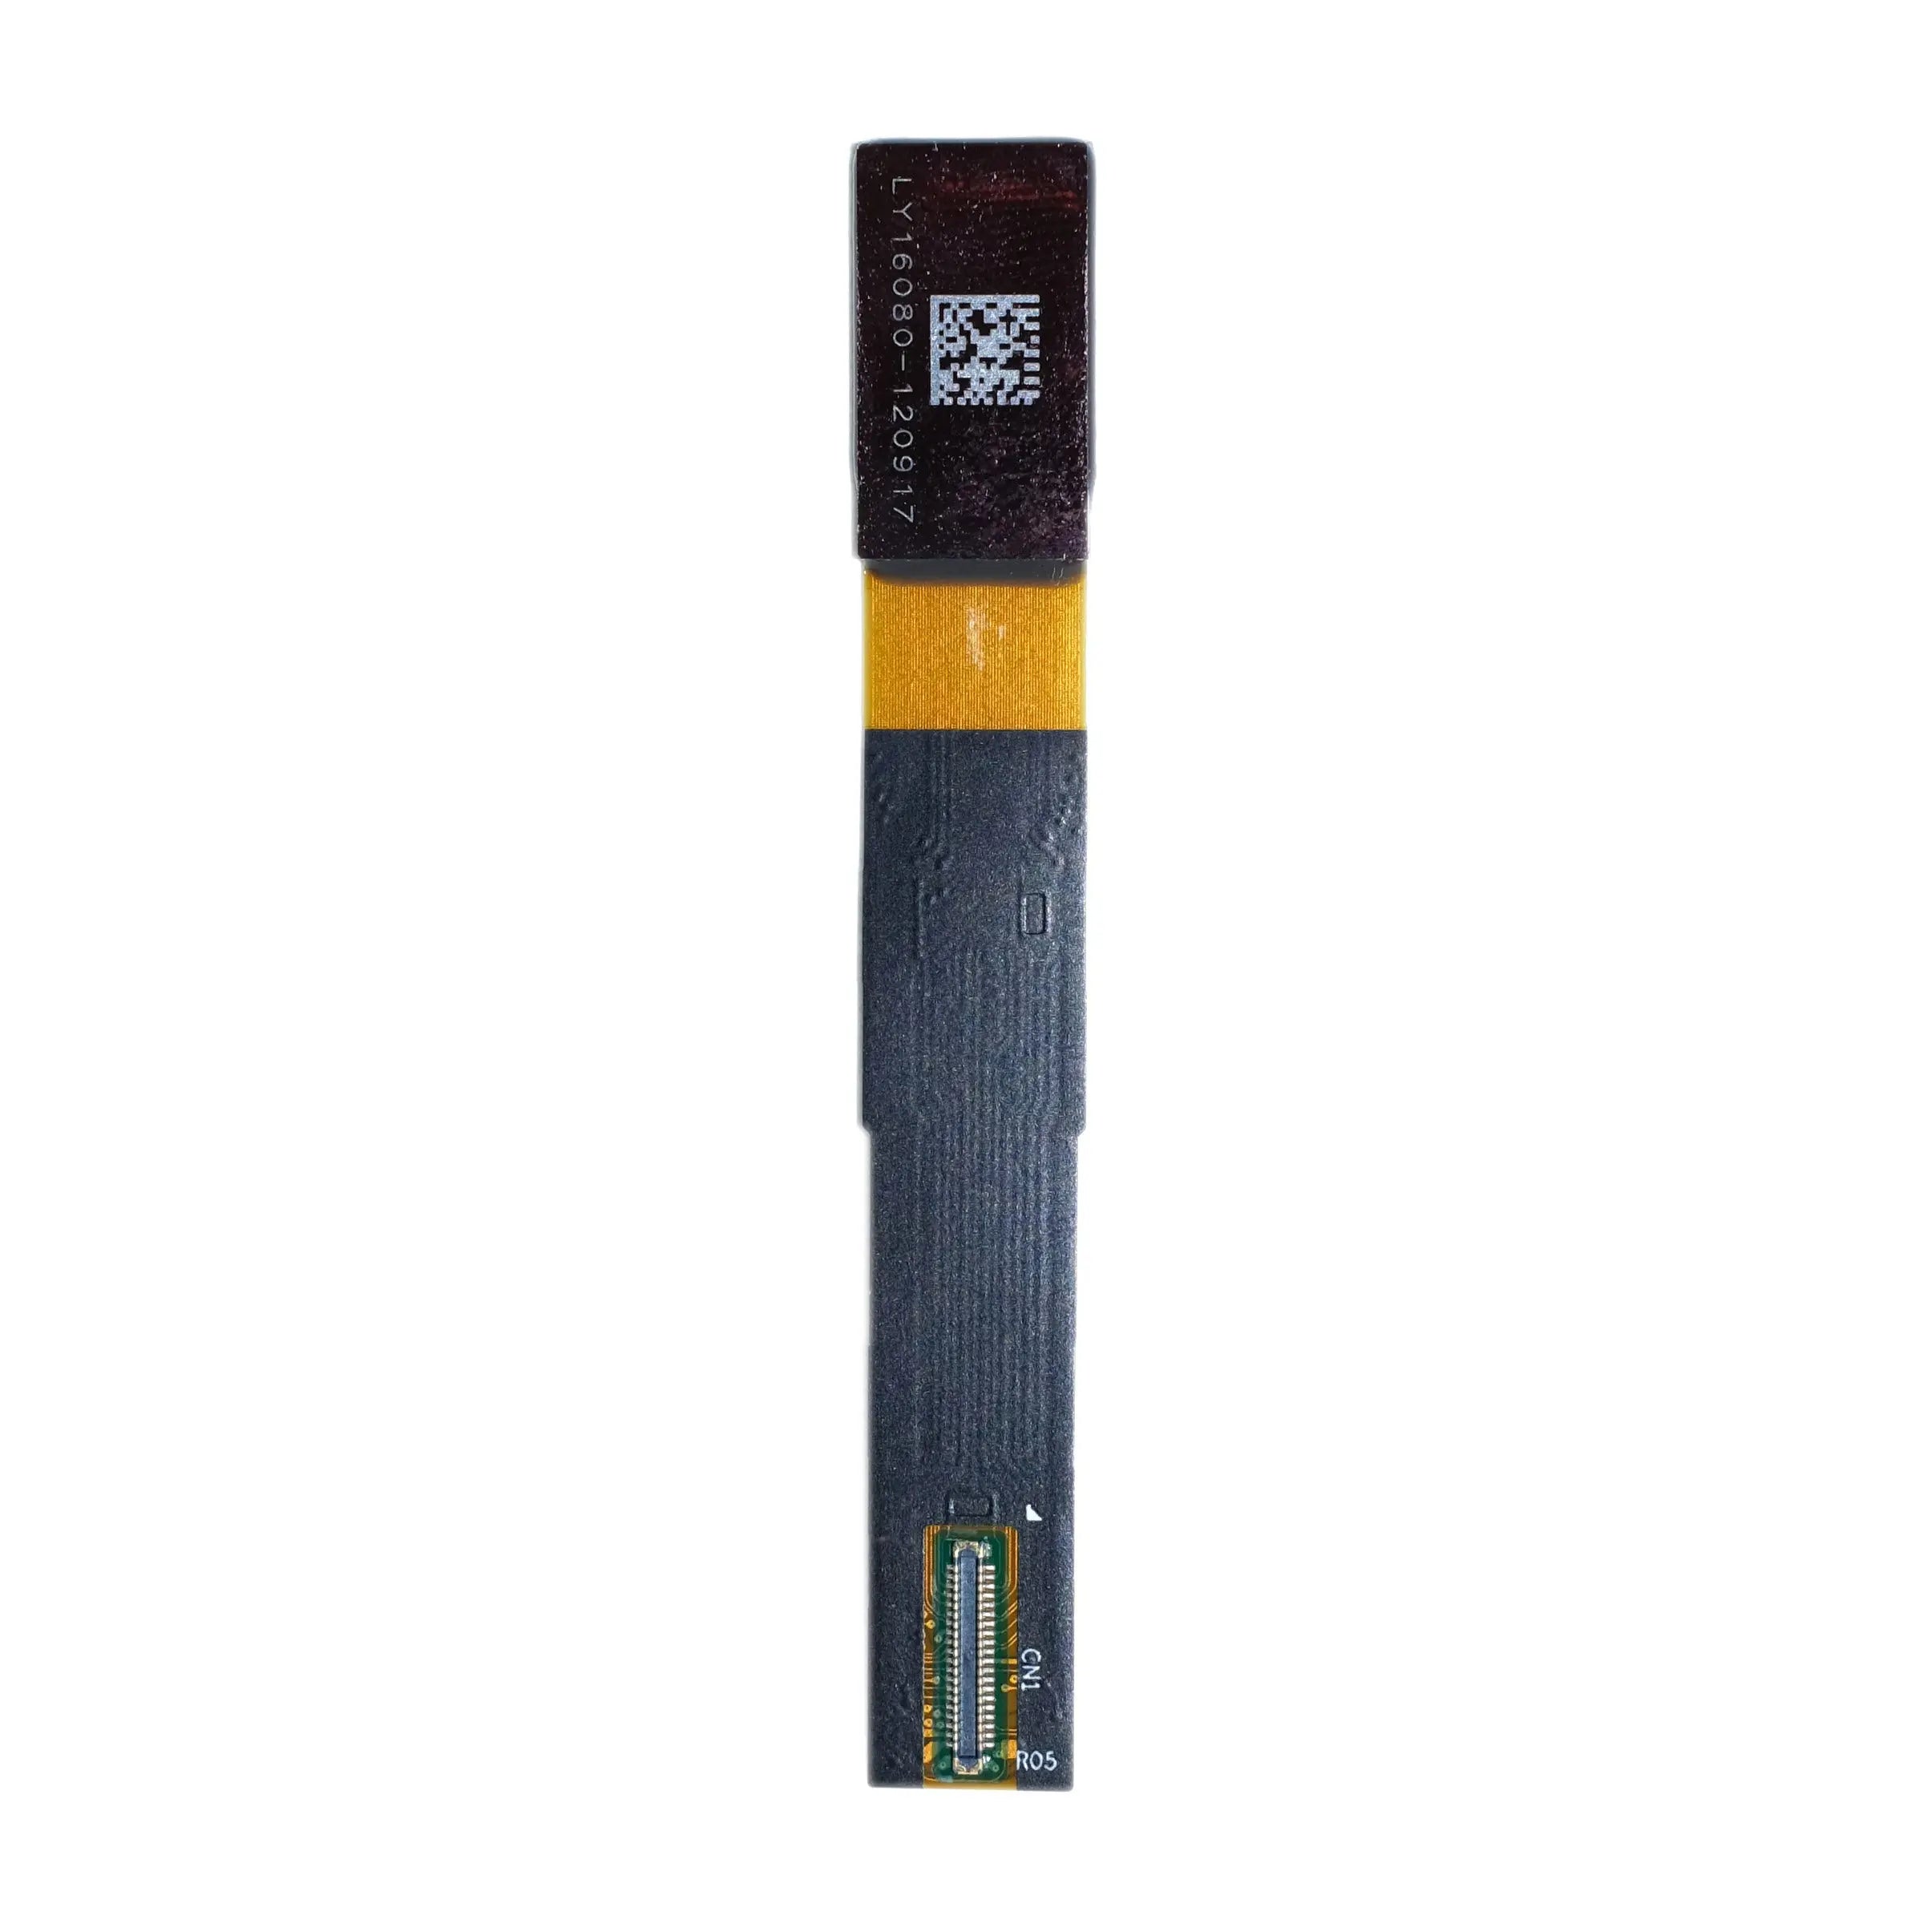
For example, an on-state luminance of 5,000 cd/m² at a 20% duty cycle gives an ideal time average of 1,000 cd/m². Sony publishes this same relation for the ECX344A example: a 5,000 cd/m² high-luminance operating level supports a stated maximum luminance of 1,000 cd/m² at 20% duty drive [1].
| On-state luminance | Duty cycle | Ideal time average |
|---|---|---|
| 5,000 cd/m² | 10% | 500 cd/m² |
| 5,000 cd/m² | 20% | 1,000 cd/m² |
| 5,000 cd/m² | 50% | 2,500 cd/m² |
| 10,000 cd/m² | 10% | 1,000 cd/m² |
| 10,000 cd/m² | 25% | 2,500 cd/m² |
The table is a timing calculation, not a guarantee of panel output. Real output can depart from the ideal value because of current limiting, voltage drop, OLED efficiency roll-off, thermal control, automatic brightness limiting, gamma processing, pulse shape, and meter integration time.
Sony announced the ECX350F with a peak brightness of up to 10,000 cd/m² [2]. That number should not be inserted directly into an AR optical budget without the matching conditions. The engineer still needs the allowed duty cycle, pattern size, temperature limit, color point, lifetime target, and time-averaged value used by the final product.
Average picture level also matters. A small white symbol on a black background can use less total current than a full white image. The same panel may therefore hold a higher local luminance for a small area than for a full field. Test at least these patterns:
| Pattern | What it checks |
|---|---|
| Small white box | Local peak capability |
| 10% white area | Current limit and local heating |
| 50% white area | Mid-load behavior |
| Full white | Maximum system load |
| Gray steps | Gamma and low-level stability |
| Red, green, blue | Channel balance and color-dependent loss |
| Moving pattern | Duty timing and motion mode |
Thermal behavior must be measured rather than assumed. Record luminance at startup and after defined periods such as 1, 5, 15, and 30 minutes. Record panel or package temperature at the same time. A fixed claim such as “brightness falls by 2% per 10°C” is not valid for every Micro OLED. The slope depends on the OLED stack, current density, compensation, heat path, and firmware.
Measure the Panel
Measure the panel before blaming the optics. A panel-side measurement gives the source term for the optical budget and helps separate display problems from optical problems.
A practical panel test should define:
- Normal or stated measurement angle
- Spot size fully inside the active image
- Meter focus and measurement distance
- Pattern size and RGB values
- Frame rate, emission duty, and exposure timing
- Panel supply voltage and current
- Panel temperature and warm-up time
- Dark subtraction and stray-light control
- At least three repeated readings
Use a meter that can handle pulsed displays. A slow meter may report a stable time average, while a fast meter or oscilloscope-connected detector can show the on-state pulse. Both values can be useful, but they must not be given the same name.
Measure angular output when the coupling lens has a limited acceptance angle. A simple scan can record luminance at 0°, ±5°, ±10°, and larger angles in both axes. The result can reveal whether a high on-axis reading is supported by a narrow emission cone or by broad output.
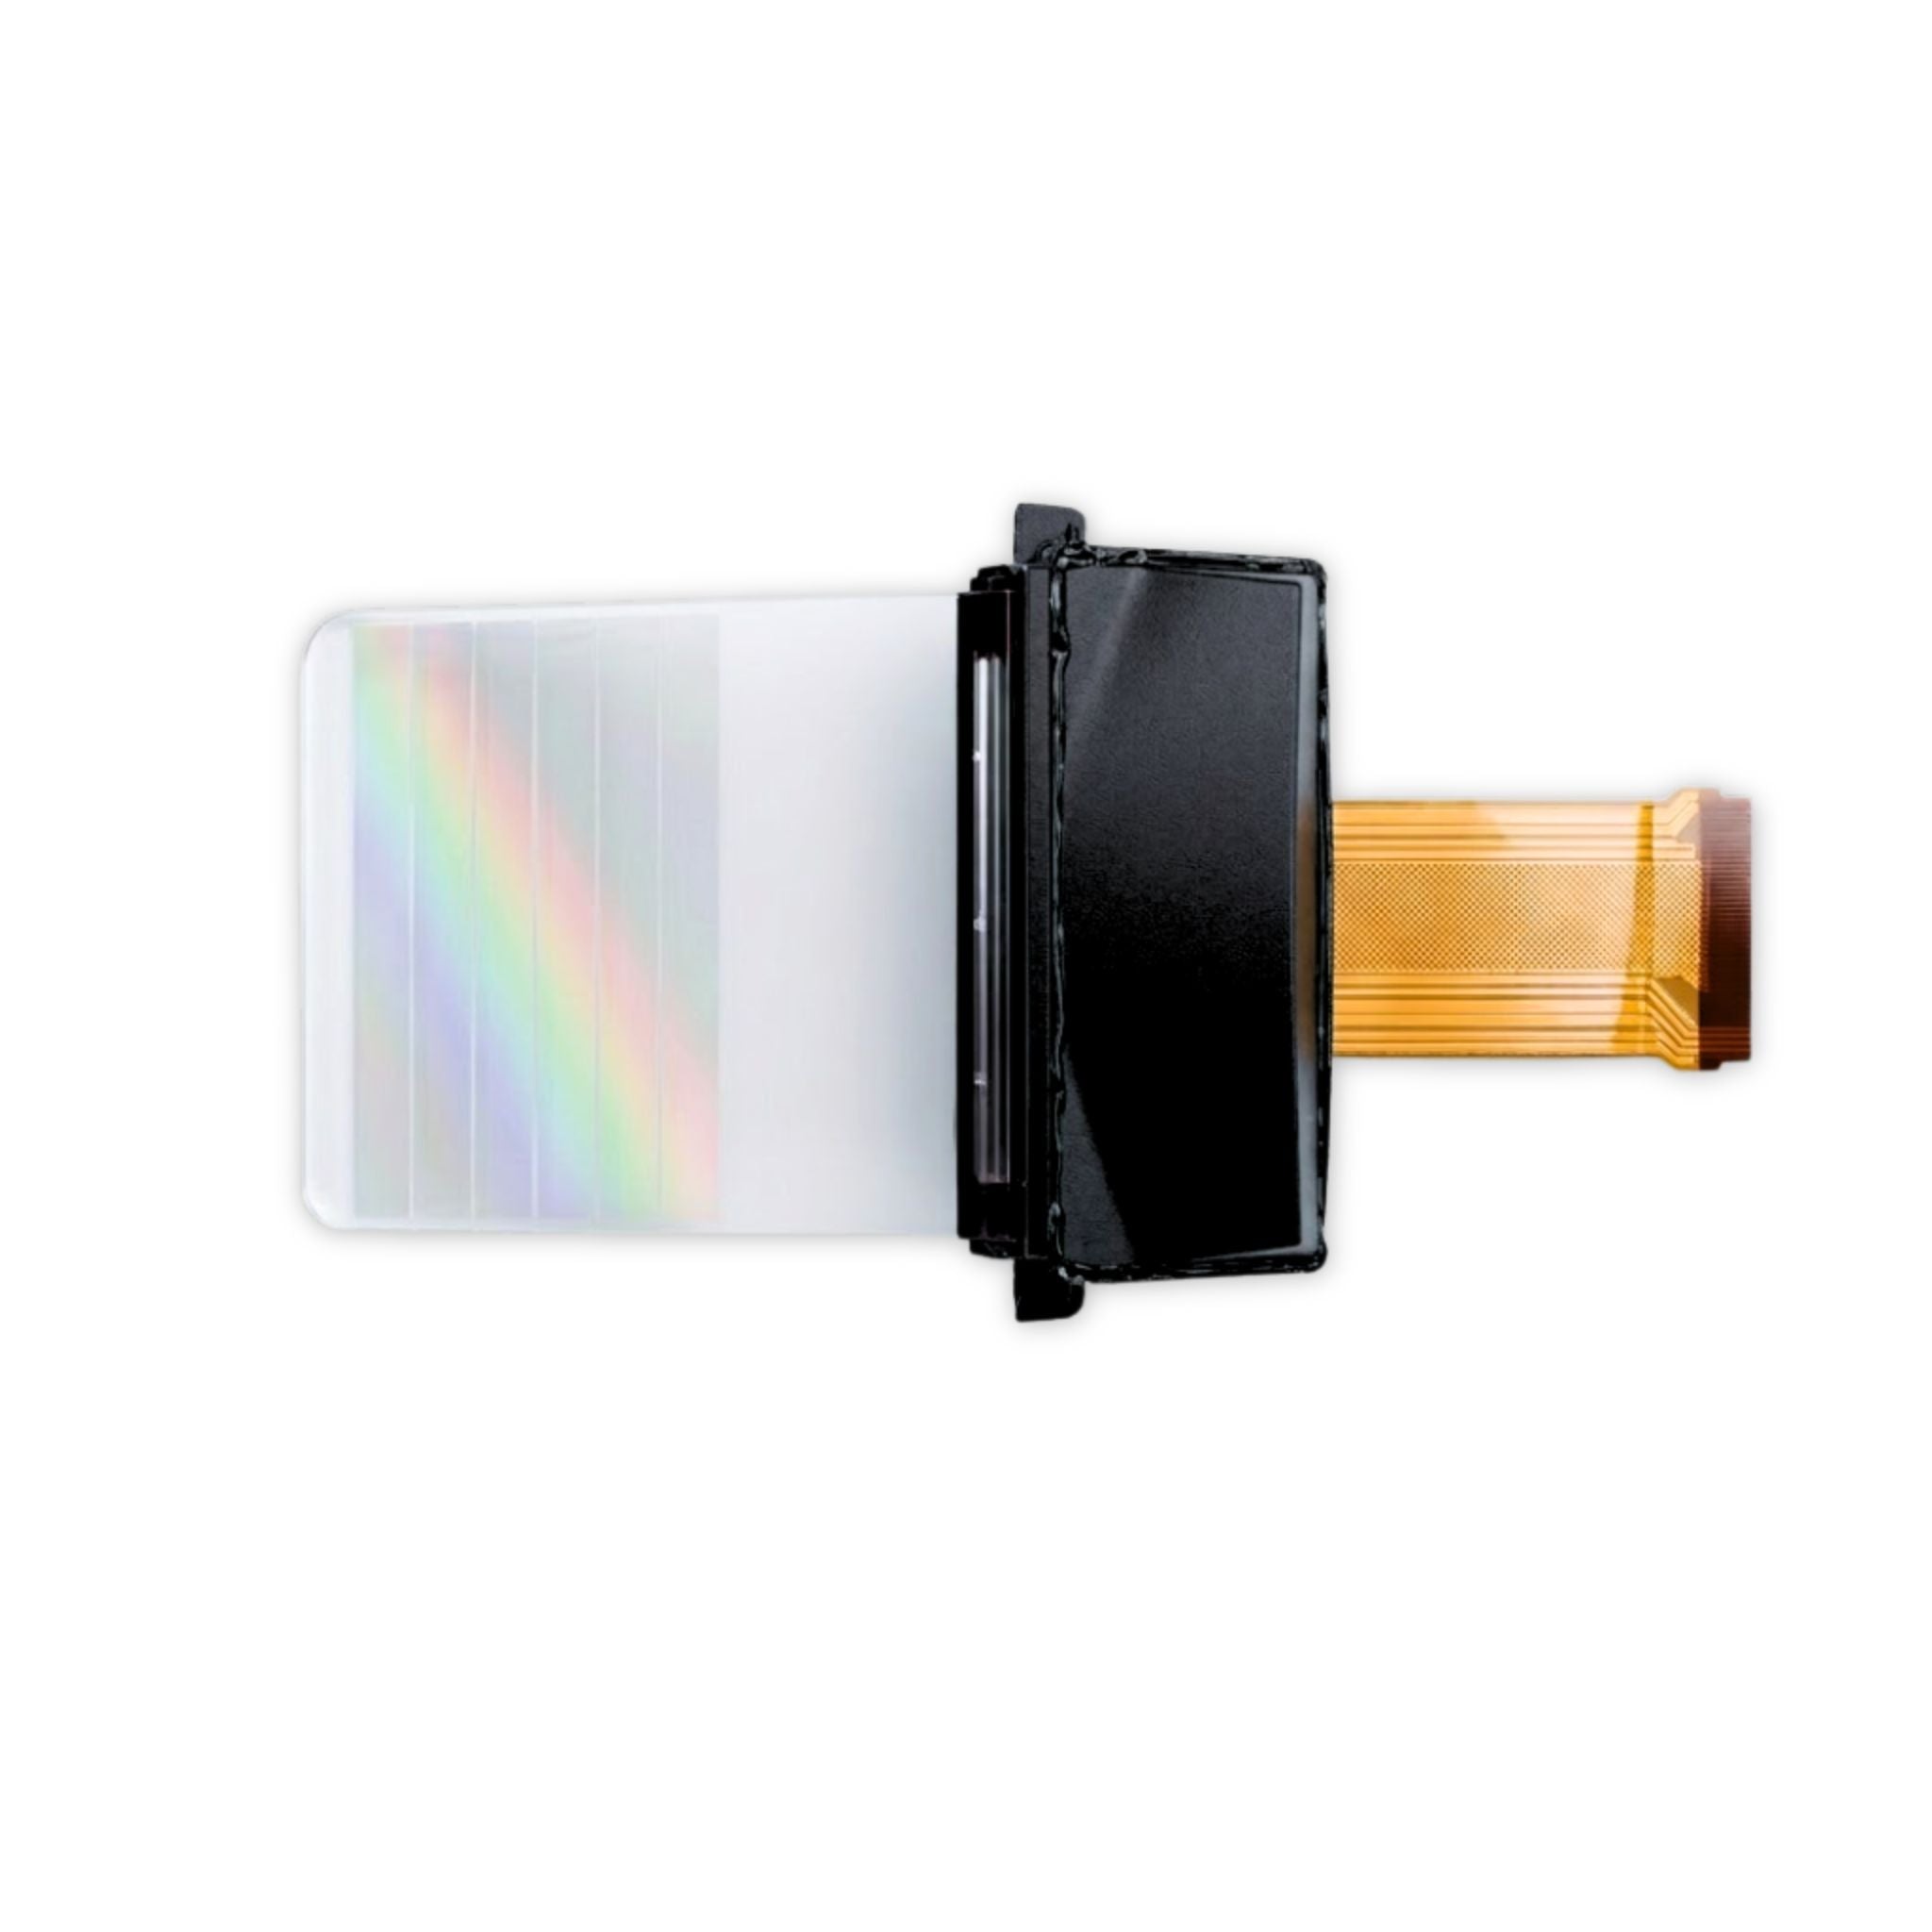
Sony reports that a microlens structure increased forward light output efficiency by 2.2 times relative to its stated conventional product [3]. This is a device-specific comparison, not a general multiplier for all Micro OLED panels. It does show why angular output and lens acceptance must be considered together.
For white light, a photopic luminance reading is often enough for an initial budget. For color balance and waveguide work, add spectral radiance or spectral luminance. Gratings, coatings, polarizers, and OLED emission spectra are wavelength dependent. A system with equal white-panel luminance can still produce red, green, and blue imbalance at the eye.
An uncertainty record makes the result more useful. Suppose the calibrated meter contributes 3%, repeatability contributes 2%, temperature control contributes 3%, and alignment contributes 4%. If these terms are independent, the combined standard uncertainty is approximately:
u = √(3² + 2² + 3² + 4²) = 6.2%
A reported panel luminance of 5,000 cd/m² would then be written as about 5,000 ± 310 cd/m² at one standard uncertainty. The exact uncertainty method should follow the laboratory procedure.
Optical Loss
Lens Surface Loss
Every optical surface can reflect, absorb, scatter, clip, or redirect light. The loss depends on wavelength, angle, polarization, coating, surface quality, aperture, and the path taken by each ray.
For an uncoated air-to-glass surface at normal incidence, a simple Fresnel estimate is:
R = ((n − 1) / (n + 1))²
For glass with refractive index n = 1.52, the reflected fraction is about 4.26% per surface. Ignoring absorption and multiple reflections, the remaining transmission after N identical surfaces is approximately:
T ≈ (1 − R)N
| Uncoated surfaces | Fresnel-only transmission | Fresnel-only loss |
|---|---|---|
| 2 | 91.7% | 8.3% |
| 4 | 84.0% | 16.0% |
| 6 | 77.0% | 23.0% |
| 8 | 70.6% | 29.4% |
This table is a basic normal-incidence calculation. Real AR optics often use oblique rays and polarization-sensitive parts. The measured spectrum and angle range of the actual coating are more important than a single catalog value.
Do not mix BirdBath and waveguide losses in one chain. They are different optical layouts.
| Layout | Typical path to model |
|---|---|
| BirdBath | Micro OLED → collimator → polarizer or retarder → beam splitter or curved combiner → eye |
| Waveguide | Micro OLED → collimator → input coupler → guide propagation and pupil expansion → output coupler → eye |
A BirdBath budget should not include a separate waveguide term unless the product really contains one. A waveguide budget should not add a generic 50% beam-splitter term unless that element exists in the path.
Polarization can dominate the loss. An ideal linear polarizer transmits no more than half of unpolarized input power before other losses. A Micro OLED and its cover optics may already have a preferred polarization state, so the measured result can be better or worse than the simple 50% case. Measure the full stack.
A first-pass optical budget is useful for finding large errors. Consider this clearly hypothetical BirdBath path:
| Stage | Assumed transmission |
|---|---|
| Collimator | 88% |
| Polarization path | 43% |
| Combiner path | 82% |
| Cover and other loss | 92% |
| Total scalar product | 28.6% |
A 6,000 cd/m² time-averaged source multiplied by 28.6% gives 1,716 cd/m² as a rough scalar estimate. The result is not a guaranteed eye-box luminance. It ignores angular clipping, etendue, nonuniform pupil fill, ghost paths, field dependence, and meter geometry. The final number must be measured at the eye point.
Waveguide Light Loss
A waveguide does more than pass light through a flat plate. It couples light into the guide, carries it by total internal reflection, spreads the pupil across an area, and couples selected rays toward the eye. Each step can depend strongly on wavelength, polarization, incident angle, field angle, and position.
It is useful to separate optical power efficiency from luminance transfer. Optical power efficiency is the output power divided by input power for a defined aperture and angular range. Luminance transfer compares panel luminance with virtual-image luminance under matched measurement conditions. These ratios are related, but they are not always numerically equal because the waveguide changes the spatial and angular distribution of light.
Use decibels carefully. Power transmission from a stated loss in decibels is:
T = 10(−Loss dB / 10)
| Loss | Power transmission |
|---|---|
| 0.1 dB | 97.7% |
| 0.5 dB | 89.1% |
| 1 dB | 79.4% |
| 3 dB | 50.1% |
| 6 dB | 25.1% |
| 10 dB | 10.0% |
A useful waveguide budget lists every boundary clearly. For example:
| Stage | Hypothetical value | What must be defined |
|---|---|---|
| Collimator output | 82% | Accepted field and angle |
| Input coupling | 45% | Color, polarization, and incidence |
| Propagation | 88% | Path length and scatter |
| Output to sampled eye box | 32% | Eye position and aperture |
| Cover optics | 92% | Angle and spectrum |
| Total scalar product | 9.6% | Only for the stated conditions |
With an 8,000 cd/m² panel value, the scalar result is about 765 cd/m². Treat this as a design estimate. The better engineering number is a measured end-to-end ratio at the nominal eye point and across the full eye box.
Pupil expansion creates a direct tradeoff. Sending more light out at the first part of the output grating can make that area bright but leave less light for later areas. Reducing local extraction can improve uniformity but lower the local output. Modern waveguide design papers treat efficiency and uniformity as linked design targets rather than independent numbers [10].
Measure each color separately. A result such as 12% for red, 10% for green, and 7% for blue will change the white point even when the panel is calibrated. The control system may need channel gain changes, but higher blue drive can increase power and aging. The optical and electrical budgets must therefore be reviewed together.
Do not publish one “typical waveguide efficiency” without defining:
- Input and output apertures
- Field of view
- Eye-box area
- Pupil or meter aperture
- Wavelength or white spectrum
- Polarization state
- Center or full-field result
- Peak, mean, or minimum result
- Whether the collimator is included
Pupil and Eyebox
The exit pupil is the optical image of the limiting aperture as seen from the eye side. The eye box is the three-dimensional region in which the eye can move while still seeing an acceptable image. Eye relief is the design distance from the last optical surface to the intended eye position. These terms should not be used as if they mean the same thing.
Human pupil size is not fixed by one lux value. It changes with scene luminance, adapting field size, age, whether one or both eyes are stimulated, time, and the individual observer. Watson and Yellott published a unified light-adapted pupil model using several of these variables [7]. A simple table that maps 1,000 lux to one pupil diameter is not reliable for all users or scenes.
Pupil diameter affects retinal illuminance. Under a simplified uniform-field model:
Retinal illuminance in trolands = Luminance in cd/m² × Pupil area in mm²
| Pupil diameter | Pupil area | Retinal illuminance at 500 cd/m² |
|---|---|---|
| 2 mm | 3.14 mm² | 1,570 trolands |
| 3 mm | 7.07 mm² | 3,535 trolands |
| 4 mm | 12.57 mm² | 6,285 trolands |
| 6 mm | 28.27 mm² | 14,135 trolands |
This calculation does not mean perceived brightness rises in direct proportion to pupil area. Visual adaptation, retinal response, glare, contrast, and the angular size of the image also matter. It is a photometric input to an eye model, not a complete perception model.
For an ideal extended image with no clipping, luminance is not reduced just because the pupil is smaller. The pupil reduces total light entering the eye, while the image luminance remains the same. In a real near-eye display, a small or displaced pupil can clip part of the ray bundle. This can cause field loss, color shift, or vignetting. The effect depends on ray geometry, not on a simple diameter ratio.
A formula such as “pupil efficiency = pupil diameter divided by exit-pupil diameter” should not be used as a general nits multiplier. Even an area ratio is valid only under restrictive assumptions about uniform beam fill, coaxial circular apertures, and what power is being referenced. Pupil-expanded waveguides often have a nonuniform array of output regions, so the actual result should be mapped.
Cholewiak and co-workers showed that moving the pupil from the nominal position can reduce light from parts of the displayed field and create vignetting, which supports measuring a perceptual eye box rather than quoting only one center point [8].
For eye-box work, record luminance on an x-y grid at several z positions. Also test eye rotation when the product expects natural gaze movement. Report both:
Minimum-to-maximum uniformity = Lmin / Lmax
Minimum-to-average uniformity = Lmin / Lavg
Do not call a fixed value such as 0.8 an industry-wide pass limit unless the product requirement or test standard defines it.
Eye Brightness
Use Correct Model
The most reliable “brightness at the eye” number is a measured virtual-image luminance at a defined eye point, aperture, field position, color, pattern, duty cycle, and temperature.
A simple engineering estimate can still be useful:
Estimated eye luminance = Time-averaged panel luminance × Measured end-to-end luminance ratio
The end-to-end ratio is:
ηL = Eye-point luminance / Panel luminance
Both measurements must use matched timing and a known pattern. The ratio is a test result for one geometry. It should not be presented as a universal waveguide efficiency.
Example:
- Panel on-state luminance: 8,000 cd/m²
- Duty cycle: 25%
- Time-averaged panel luminance: 2,000 cd/m²
- Measured end-to-end luminance ratio: 8%
- Estimated eye-point luminance: 160 cd/m²
This method avoids double counting. If the end-to-end ratio already includes the collimator, couplers, waveguide, cover, and measurement aperture, do not multiply those terms again.
A stage-by-stage model is useful before hardware exists, but its boundaries must be clear. Use one of these two approaches:
| Approach | Use | Main risk |
|---|---|---|
| Stage budget | Early design and loss tracing | Double counting or missing angle limits |
| Measured end-to-end ratio | Prototype and product verification | Result applies only to the measured setup |
Include uncertainty. If panel measurement uncertainty is 3%, eye-point meter uncertainty is 5%, alignment is 8%, and repeatability is 2%, the combined standard uncertainty is:
u = √(3² + 5² + 8² + 2²) = 10.1%
An eye-point result of 160 cd/m² would therefore carry about ±16 cd/m² at one standard uncertainty. Alignment often becomes one of the largest terms in waveguide measurements, so a repeatable fixture is essential.
A scalar model cannot capture every field point. A complete result is a function of image field, eye position, wavelength, angle, time, and temperature. At minimum, map center and corners for each primary color and for white.
Check Ambient Contrast
Outdoor readability is a contrast problem, not a direct comparison between nits and lux. A statement such as “1,200 nits is below 10,000 lux” compares different physical quantities and has no valid ratio.
For an optical see-through display, the eye receives both the virtual image and the transmitted real scene. A simple luminance model is:
Background at the eye = Ambient transmittance × Scene luminance + Veiling luminance
Display on luminance = Background at the eye + Virtual image luminance
Display off luminance = Background at the eye + Black-state leakage
Contrast ratio = Display on luminance / Display off luminance
Weber contrast = (Display on luminance − Display off luminance) / Display off luminance
Lux can be converted to an approximate luminance only when surface reflectance and geometry are known. For a diffuse Lambertian surface:
Scene luminance ≈ Illuminance × Reflectance / π
Example office calculation:
- Illuminance on a diffuse surface: 500 lux
- Surface reflectance: 0.50
- Estimated scene luminance: 500 × 0.50 / π = 79.6 cd/m²
- See-through transmittance: 80%
- Background at the eye before stray light: 63.7 cd/m²
- Virtual image luminance: 160 cd/m²
- Black leakage and veil: 2 cd/m²
- Display off: 65.7 cd/m²
- Display on: 225.7 cd/m²
- Contrast ratio: 3.44:1
- Weber contrast: 2.44
Example bright outdoor calculation:
- Illuminance on a diffuse surface: 100,000 lux
- Surface reflectance: 0.20
- Estimated scene luminance: 6,366 cd/m²
- See-through transmittance: 80%
- Background at the eye: about 5,093 cd/m² before added veil
- Virtual image luminance: 160 cd/m²
- Approximate Weber contrast: 160 / 5,093 = 0.031
The assumptions matter. A bright sky, white vehicle, dark road, indoor wall, and specular metal surface can have very different luminance under the same measured lux. The final test should therefore use controlled background targets or measured real scenes, not lux alone.
Ambient transmittance and virtual-image efficiency are separate design variables. A darker combiner can improve virtual-to-background contrast by reducing the real scene, but it also reduces see-through visibility and may affect safety. Some optical paths attenuate ambient and display light differently, so both paths must be measured.
Color contrast also matters. A virtual blue symbol may lose more luminance than green in the waveguide, while a blue-rich sky raises the background in the same channel. Report luminance and chromaticity for white and the three primary colors.
Measure at Eye
Do not measure an AR display by holding a luminance meter at an arbitrary distance. Place the entrance pupil of the measurement system at the defined eye point and focus on the virtual image. The instrument can be an imaging photometer, a spot luminance meter with suitable optics, or a calibrated spectral radiance system.
The result depends on the instrument aperture. A small aperture samples a small part of the exit pupil and can reveal local nonuniformity. A larger aperture averages more of the pupil. There is no universal aperture that fits every product. Select the aperture for the requirement and report it.
Luminance of an extended virtual image does not follow the inverse-square law in the same way as illuminance from a point source. Moving the meter by 1 mm matters because it changes pupil alignment, clipping, focus, and the sampled ray bundle, not because luminance should automatically scale with distance squared.
IEC 63145-20-10:2019 covers fundamental optical measurement methods for eyewear displays [4]. IEC 63145-22-10:2020 addresses AR optical properties, including see-through and ambient optical performance [5]. IEC 63145-22-20:2024 covers image-quality measurements for AR eyewear displays [6]. Use the edition required by the project and the full standard text when claiming compliance.
A practical test sequence is:
- Calibrate the meter and verify dark response.
- Mount the product in a repeatable fixture.
- Set the nominal eye relief and eye point.
- Focus on the virtual image, not the cover surface.
- Set the test aperture and state its diameter.
- Run the specified warm-up period.
- Record panel drive, duty, frame rate, temperature, and power.
- Measure white, black, gray, red, green, and blue patterns.
- Scan the eye box in x, y, and z.
- Repeat selected points after thermal stabilization.
- Run ambient contrast tests with controlled backgrounds.
- Report uncertainty and repeatability.
A useful measurement matrix is:
| Test item | Suggested points | Reason |
|---|---|---|
| Warm-up | 0, 5, 15, 30 minutes | Find thermal drift |
| Pattern | Black, gray, white, RGB, checkerboard | Check level and color |
| Image area | Small patch, 10%, 50%, full field | Check current limits |
| Eye position | Center, left, right, up, down | Map eye-box loss |
| Eye distance | Nominal and tolerance limits | Check z sensitivity |
| Aperture | Project-defined small and large pupils | Check pupil sampling |
| Field point | Center and image corners | Check field uniformity |
| Ambient | Dark and controlled bright targets | Measure contrast |
| Temperature | Product operating range | Check output and color drift |
For a 3 × 3 eye-box scan, report all nine values. Then calculate the mean, minimum, maximum, standard deviation, minimum-to-maximum ratio, and minimum-to-average ratio. A heat map can be useful on the published page, but the raw values should also be retained.
The final report should contain:
- Panel luminance and its test condition
- Eye-point luminance at the nominal position
- End-to-end luminance ratio
- Eye-box map and field map
- White point and RGB chromaticity
- Black level and contrast
- Ambient transmittance
- Power and temperature
- Warm-up and measurement time
- Instrument, aperture, focus, and calibration
- Uncertainty and repeatability
The central engineering lesson is simple: panel nits are the source value, not the product result. Optical loss must be defined for the real architecture. Pupil effects must be tested as geometry and sampling, not reduced to one diameter ratio. Outdoor use must be judged by ambient contrast. The value that should be published as brightness at the eye is the luminance measured at a stated eye point under a stated operating condition.
Weiterlesen
An AMOLED panel can stay completely black even when the OLED pixels and glass are not damaged. The display driver IC may be powered only partly, held in reset, left in Sleep In mode, blocked by...
PMOLED power cannot be estimated from panel resolution alone. The result depends on the image pattern, grayscale level, segment current, multiplex ratio, display voltage, driver overhead, charge-pu...
Hinterlasse einen Kommentar
Diese Website ist durch hCaptcha geschützt und es gelten die allgemeinen Geschäftsbedingungen und Datenschutzbestimmungen von hCaptcha.