


How to Estimate PMOLED Power Consumption | Lit Pixels, Brightness and Duty Cycle
PMOLED power cannot be estimated from panel resolution alone. The result depends on the image pattern, grayscale level, segment current, multiplex ratio, display voltage, driver overhead, charge-pump or boost-converter efficiency, and the way the current is measured. A module specification may quote current at the display rail, at the battery rail, or at a single combined supply. These values are not interchangeable.
A PMOLED panel does not use one thin-film transistor at every pixel. The driver selects one common row, or one scan group, and drives the required segment columns during that row time. The next row is then selected. Because the pixels do not store their state, the driver must continue scanning even when the image does not change.
The safest estimate starts with a real module specification and then uses measurements from the final image patterns. A bottom-up equation is useful for early sizing, but it must be checked against bench data. Do not apply a multiplex duty factor twice. If a datasheet gives an average operating current for a displayed test pattern, the scanning duty is already included in that measured value.
| Input | What it means | Why it matters |
|---|---|---|
| Pixel load | The fraction and weight of lit pixels | Sets the number of active segment current paths |
| Contrast setting | The programmed segment-current level | Changes peak current and luminance |
| Multiplex ratio | The number of common rows in the scan | Changes row time and required peak current |
| Display rail | The OLED drive voltage, often called VCC, VPP, or VOLED | Sets display-rail power together with current |
| Converter efficiency | Output power divided by input power | Converts display-rail power into battery-rail power |
| Driver overhead | Logic, oscillator, level shifter, precharge, and interface power | Creates power that does not scale directly with lit pixels |

Count Active Pixels
Count Pixel Load
For a binary monochrome image, the first useful quantity is the pixel-on ratio. It is the number of lit pixels divided by the total number of pixels. The count must be done on the image after scaling, font rendering, clipping, and any driver remapping. Counting the source artwork before it is converted into display memory can give the wrong answer.
A 256 x 64 panel contains 16,384 pixels. If 20% of them are on, the binary-equivalent lit count is about 3,277 pixels, not tens of thousands. A 128 x 64 panel contains 8,192 pixels; a 25% pattern contains about 2,048 lit pixels.
| Resolution | Total pixels | 10% load | 25% load | 50% load | 100% load |
|---|---|---|---|---|---|
| 128 x 32 | 4,096 | 410 | 1,024 | 2,048 | 4,096 |
| 128 x 64 | 8,192 | 819 | 2,048 | 4,096 | 8,192 |
| 128 x 128 | 16,384 | 1,638 | 4,096 | 8,192 | 16,384 |
| 256 x 64 | 16,384 | 1,638 | 4,096 | 8,192 | 16,384 |
The same pixel-on ratio can produce different peak row currents. A pattern with 50% of the pixels evenly spread across all rows has a different instantaneous load from a pattern that puts most of its lit pixels in a few rows. The frame-average OLED current can be similar, but the concentrated pattern creates larger row-current pulses, more supply droop, and more stress on the segment drivers.
For this reason, count both the total image load and the busiest row. For a display with C columns, define the busiest-row ratio as the largest number of lit columns in any selected row divided by C. A 128-column panel with 64 lit columns in every row has a 50% total load and a 50% busiest-row load. A panel with every pixel lit in half of the rows has the same 50% total load but a 100% busiest-row load.
Use actual display-memory data when possible. For a one-bit monochrome frame, count all bits set to one. For an animated screen, calculate the load of every frame and then report at least the average, the 95th percentile, and the highest frame. The highest frame helps size the supply. The time average helps estimate battery life.
| Pattern result | Use |
|---|---|
| Average pixel load | Long-term energy estimate |
| 95th-percentile load | Normal high-load design point |
| Maximum frame load | Peak supply and thermal check |
| Busiest-row load | Peak segment-current and rail-droop check |
| Longest static pattern | Image-retention and aging review |
There is no universal pixel-load range for text, icons, charts, or menus. Font size, stroke width, anti-aliasing, language, border design, and background polarity can change the result by several times. A black background with white text usually uses less OLED current than the same page inverted to a white background, but the exact saving must be counted from the real frame buffer.
Handle Gray Levels
For a grayscale PMOLED, a pixel cannot be treated as simply on or off. The driver creates gray levels by changing the emission time, the segment current, or both. A four-bit image has codes from 0 to 15, but code 8 does not always produce exactly half the current or half the luminance of code 15. The driver may use a nonlinear gray table, precharge control, current scaling, or a gamma curve.
A useful first estimate is an effective pixel load. Assign each gray code a normalized electrical weight between zero and one, add the weights of all pixels, and divide by the total pixel count. If the driver uses a linear pulse-width table, the first estimate can use gray code divided by the maximum code. This is only a starting point. The final weights should be based on measured current for the actual driver setup.
For example, a 256 x 64 four-bit frame has 16,384 pixels. If half the pixels are at code 15 and half are at code 0, the linear effective load is 50%. If every pixel is at code 8, the simple code-based load is 8 divided by 15, or about 53.3%. The measured electrical load may differ because the gray table is not guaranteed to be linear.
| Gray code | Simple starting weight | What to verify |
|---|---|---|
| 0 of 15 | 0.000 | Display-on dark current is still present |
| 1 of 15 | 0.067 | Low-code pulse width may be nonlinear |
| 4 of 15 | 0.267 | Check precharge and minimum pulse effects |
| 8 of 15 | 0.533 | Do not assume half luminance without measurement |
| 12 of 15 | 0.800 | Check current and thermal rise |
| 15 of 15 | 1.000 | Use as the reference only if the driver is not limiting |
The best way to build the weight table is to display full-screen gray fields at several codes while keeping the display clock, multiplex ratio, contrast register, temperature, and supply voltage fixed. Measure both display-rail current and logic-rail current. Subtract the display-on black-screen baseline before normalizing the pattern-dependent part.
| Test field | Measure | Purpose |
|---|---|---|
| Display off | All rail currents | Sleep or shutdown baseline |
| Display on, code 0 | All rail currents | Active driver overhead |
| Full screen, code 1 | Current and luminance | Low-code behavior |
| Full screen, code 4 | Current and luminance | Lower-mid behavior |
| Full screen, code 8 | Current and luminance | Midscale behavior |
| Full screen, code 12 | Current and luminance | Upper-mid behavior |
| Full screen, code 15 | Current and luminance | Full-scale reference |
Color PMOLED requires a separate load model for each color channel. Do not assume that every color PMOLED uses RGBW. Many color drivers use red, green, and blue segments, while other products may use different layouts. The current needed for the same luminance depends on the emitter materials, color point, segment area, driver settings, and aging state.
For color content, use a channel-weighted model based on measurements. Measure full red, full green, full blue, white, and representative mixed colors. Do not import fixed luminous-efficiency numbers or a universal red-green-blue current ratio from another panel. A current ratio that is correct for one material stack can be wrong for another.
Compare Real Patterns
Manufacturer data at a named test pattern is the best early design anchor. A common condition is a 50% checkerboard pattern. This does not mean that every 50% image will produce exactly the same peak row current, but it provides a repeatable reference for comparing the module with its own specification.
The examples below show why a single rule such as “PMOLED uses 7.5 V” or “power scales directly with area” is not reliable. These are different modules with different sizes, drivers, display voltages, materials, and brightness settings. The calculated power is display-rail voltage multiplied by the quoted display-rail current. It does not include every logic or conversion loss unless the module specification states that the current is measured at a combined input.
| Module example | Resolution | Duty | Test condition | Display rail | Quoted current | Rail power |
|---|---|---|---|---|---|---|
| Winstar WEO012832F | 128 x 32 | 1/32 | Specified operating condition | 7.25 V | 7 mA typical, 11 mA maximum | 50.8 mW typical, 79.8 mW maximum |
| Winstar WEO012864AC | 128 x 64 | 1/64 | 50% display on, external VCC | 12 V | 10 mA typical, 20 mA maximum | 120 mW typical, 240 mW maximum |
| Winstar WEO128128G | 128 x 128 | 1/128 | 50% checkerboard | 12 V | 15 mA typical, 25 mA maximum | 180 mW typical, 300 mW maximum |
| Winstar WEX025664AL | 256 x 64 | 1/64 | 50% checkerboard | 14.5 V | 25 mA typical, 32 mA maximum | 362.5 mW typical, 464 mW maximum |
| Winstar WEO025664D | 256 x 64 | 1/64 | 50% checkerboard | 16 V | 35 mA typical | 560 mW typical |
These examples should not be normalized by physical area without more information. The 128 x 128 and 256 x 64 examples contain the same number of pixels, but their display-rail power differs greatly. The reason can include pixel area, emitter color, target luminance, segment-current setting, drive voltage, driver architecture, and panel generation.
When using a 50% checkerboard value to estimate another pattern, keep the estimate local. A first-order ratio may be useful between nearby loads at the same contrast setting, but verify at 0%, 25%, 50%, 75%, and 100%. Some modules show a fixed active-driver current plus a pattern-dependent current, so total current does not pass through zero when no pixels are lit.
A practical pattern set includes all black, one-pixel lines, small text, the normal home screen, the brightest intended page, 50% checkerboard, all white, and the highest-current color field for a color panel. Test every pattern at the lowest, normal, and highest allowed contrast settings.
Set Drive Current
Know Display Rails
PMOLED modules often have more than one power domain. The logic rail may be called VDD, VCI, or VDDIO. The OLED display rail may be called VCC, VPP, or VOLED. Some modules require an external high-voltage display rail. Other modules include a charge pump or a boost converter and accept a lower battery or board voltage.
The rail name alone does not identify the voltage. In the published module examples above, the display rail ranges from 7.25 V to 16 V. Logic rails are commonly around 3 V in those examples, but that is not a universal limit. Always use the exact module revision and its electrical-characteristics table.
| Rail type | Common names | Measure here | Main power term |
|---|---|---|---|
| Logic supply | VDD, VCI, VDDIO | At the module connector | Logic voltage x logic current |
| Display supply | VCC, VPP, VOLED | At the module connector or converter output | Display voltage x display current |
| Converter input | VBAT, VIN | At the converter input | Input voltage x input current |
| Host interface | MCU or processor rail | At the host supply if needed | Interface and firmware activity |
If the display rail is supplied externally, measure logic and display current separately. If an internal charge pump is used, measure the input current at the charge-pump supply and note its input voltage. Do not add an external display-rail calculation to a current value that already includes the internal converter.
The power at the module connector can also differ from power at the regulator output because of cable and connector resistance. If a 15 mA display current flows through 1.0 ohm of total path resistance, the drop is 15 mV and the path loss is 0.225 mW. At 100 mA, the same resistance causes a 100 mV drop and 10 mW loss. Short pulses can create a larger temporary drop than a slow meter shows, so use an oscilloscope when the screen flickers or dims on bright patterns.
Measure the display voltage under the highest intended load, not only with the display off. Also measure startup overshoot, steady ripple, and the minimum voltage during the busiest row. A correct average voltage can hide short dips that reduce luminance or cause driver resets.
Set Contrast Current
The display contrast command usually changes the segment-current amplitude or a current scale inside the driver. It is not a guaranteed percentage of optical brightness. A register value of half scale does not necessarily produce half current, half luminance, or half power.
PMOLED drivers do not control a thin-film transistor at each pixel. During a selected row, the segment driver sources or sinks current through the lit OLED segments. Peak segment current can be hundreds of microamps in some driver families. The exact current is set by the driver design, external reference components, contrast commands, master-current commands, and timing settings.
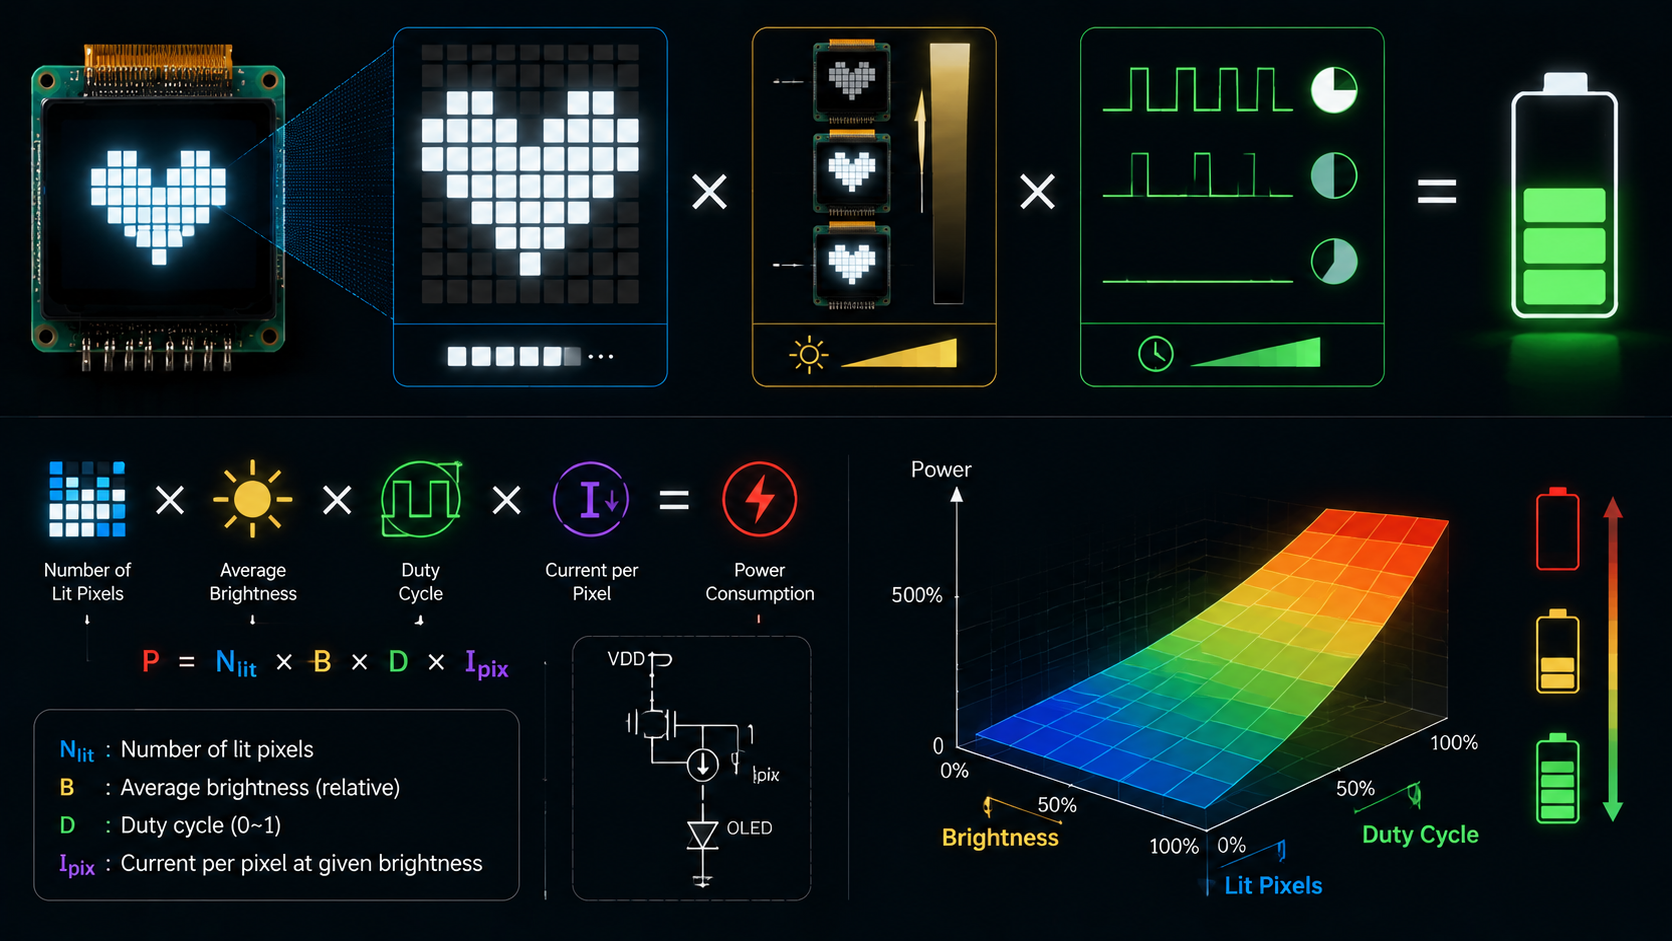
Use three separate terms:
- Peak segment current: current in one lit segment while its common row is selected.
- Average OLED current: the frame-average sum of all segment currents.
- Module input current: current drawn from a named external supply, including driver and conversion overhead as defined by the module.
These three values can differ by a large factor. A current probe may show narrow row-current pulses even when a digital meter reports a modest average current.
Build a contrast table for the final module. Keep the image, display clock, temperature, and supply fixed. At each contrast code, record display current, logic current, luminance, and the hottest measured component. The relation is often close enough to linear over a limited range for interpolation, but it should not be assumed across the full register range.
| Setting | Display pattern | Record |
|---|---|---|
| Minimum usable contrast | Normal UI and checkerboard | Current, luminance, uniformity |
| Low contrast | Normal UI and checkerboard | Current, luminance, color or gray shift |
| Nominal contrast | Normal UI and checkerboard | Primary design point |
| High contrast | Brightest UI and all white | Peak current and temperature |
| Maximum allowed contrast | Worst allowed pattern | Supply margin and reliability review |
Brightness should be measured with a luminance meter under a defined pattern and temperature. Electrical current alone cannot confirm optical performance. Two modules drawing the same power may have different luminance because of emitter efficiency, aperture ratio, polarizer loss, color, and aging.
Do not use a universal recommendation such as operating only between 20% and 80% contrast. The safe and useful range is product-specific. Follow the module limits and validate low-level uniformity, high-level temperature, and lifetime at the intended setting.
Include Converter Loss
If a boost converter generates the display rail, its efficiency must be applied correctly. Converter efficiency is output power divided by input power. Therefore, input power equals output power divided by efficiency. Converter loss is input power minus output power.
For a display rail of 12 V at 15 mA, output power is 180 mW. At 90% efficiency, converter input power is 200 mW and converter loss is 20 mW. Multiplying output power by one minus efficiency would give 18 mW, which is close in this case but is not the exact loss equation.
| Display output | Efficiency | Input power | Converter loss | Input current at 3.7 V |
|---|---|---|---|---|
| 120 mW | 90% | 133.3 mW | 13.3 mW | 36.0 mA |
| 180 mW | 90% | 200.0 mW | 20.0 mW | 54.1 mA |
| 300 mW | 90% | 333.3 mW | 33.3 mW | 90.1 mA |
| 362.5 mW | 88% | 411.9 mW | 49.4 mW | 111.3 mA |
| 560 mW | 88% | 636.4 mW | 76.4 mW | 172.0 mA |
The battery-current column covers the display converter only. Add logic current, microcontroller current, communication current, sensor load, and regulator quiescent current. Also use the actual battery voltage range. Current rises as battery voltage falls if output power remains constant.
Efficiency is not one fixed number. It changes with input voltage, output voltage, load current, switching mode, inductor, diode or synchronous switch, temperature, and board layout. Measure or use the converter efficiency curve near the real operating point. Light-load pulse-skipping behavior can make the display-on black-screen case less efficient than a medium-load pattern.
A complete product-input estimate is the sum of every rail after each conversion stage. If the display converter and logic regulator are separate, calculate them separately. A practical form is:
Battery power = display-rail power / display-converter efficiency + logic-rail power / logic-regulator efficiency + host and other loads.
For battery-life planning, use time-weighted operating modes. A 1,000 mAh cell does not provide exactly 1,000 mAh at every load, temperature, cutoff voltage, and aging state. As a simple screen-only example, a measured average of 60 mA would give 16.7 hours from an ideal 1,000 mAh source. The real product runtime will be shorter after adding other loads and battery derating.
Check Scan Timing
Use Multiplex Duty
A 1/64 multiplex ratio usually means that one of 64 common rows is selected during each row period. Each row receives about one sixty-fourth of the frame time in a simple single-row scan. Some drivers use dual-common or other scan arrangements, so use the actual driver description.
The multiplex factor must be applied only once. If the calculation starts with peak segment current, row duty is needed. If the calculation starts with a module current measured while the display is running, the duty has already been included.
For a simple one-row-at-a-time monochrome scan, the ideal frame-average OLED current can be written as peak segment current multiplied by the total number of lit pixels and divided by the number of scanned rows. The same result can be written as peak segment current multiplied by the average number of lit columns per row.
Consider a 128 x 64 display with a 50% pattern spread evenly across all rows. Each selected row has about 64 lit segments. If peak segment current is 100 uA, the ideal average OLED current is about 6.4 mA. Multiplying this value by 1/64 again would be wrong because the row averaging has already been performed.
| Example | Columns | Rows | Effective load | Peak segment current | Ideal average OLED current |
|---|---|---|---|---|---|
| 128 x 64 text-like load | 128 | 64 | 10% | 100 uA | 1.28 mA |
| 128 x 64 checkerboard | 128 | 64 | 50% | 100 uA | 6.40 mA |
| 128 x 64 all on | 128 | 64 | 100% | 100 uA | 12.80 mA |
| 256 x 64, 20% load | 256 | 64 | 20% | 200 uA | 10.24 mA |
This table is a mathematical example, not a specification for those panels. Real current includes driver overhead, precharge current, leakage, grayscale timing, and converter loss. Peak segment current is not known from resolution and must come from the driver design or measurement.
At the same target average luminance, a panel with more multiplexed rows often needs a larger peak segment current because each row is active for a smaller fraction of the frame. The required increase is not guaranteed to be exactly proportional to the row count. OLED efficiency, pulse shape, precharge, voltage drop, and current limits affect the result.
Multiplex ratio therefore affects peak-current stress more directly than it predicts total power. A 1/128 panel can have high current pulses even when its average supply current appears moderate. Check the busiest-row waveform, converter current limit, output capacitor ripple, and the voltage at the panel connector.
Check Refresh Load
A PMOLED pixel has no storage transistor and capacitor that can hold the image between rare updates. The common rows must continue to scan to maintain a steady image. A static frame stored in driver RAM reduces host data traffic, but it does not allow the panel scan to stop or fall to 1 Hz while preserving a normal flicker-free image.
Changing the display clock or frame frequency can change driver switching power and row timing. It does not mean that OLED emission power automatically rises in direct proportion to refresh rate. If peak current and total emission time per second remain controlled, the pattern-dependent OLED energy may remain similar while driver and line-charging losses change.
Do not use an unsupported rule such as “60 Hz to 120 Hz increases PMOLED power by a fixed percentage.” Measure the actual module at valid driver settings. Keep pattern, contrast, supply voltage, and temperature constant. Record average current, ripple, luminance, flicker, and uniformity.
| Refresh test | Keep fixed | Measure |
|---|---|---|
| Lowest valid clock | Pattern, contrast, voltage | Current, flicker, luminance |
| Nominal clock | Pattern, contrast, voltage | Reference current and luminance |
| Highest valid clock | Pattern, contrast, voltage | Switching loss, heat, ripple |
| Cold temperature | Nominal pattern and clock | Startup and luminance stability |
| Hot temperature | Nominal pattern and clock | Current, thermal rise, brightness drift |
A driver frame buffer can still save system power by reducing processor and interface activity. A 128 x 64 one-bit frame contains 8,192 bits, or 1,024 bytes. Sending a complete frame 60 times per second transfers at least 61,440 payload bytes per second before command and bus overhead. Sending only one update per second reduces host payload to 1,024 bytes per second, while the PMOLED driver continues its internal scan.
| Frame format | Bytes per frame | Updates per second | Payload rate |
|---|---|---|---|
| 128 x 64, 1 bit | 1,024 | 60 | 61,440 bytes/s |
| 128 x 64, 1 bit | 1,024 | 1 | 1,024 bytes/s |
| 256 x 64, 4 bit | 8,192 | 30 | 245,760 bytes/s |
| 256 x 64, 4 bit | 8,192 | 1 | 8,192 bytes/s |
The power saving from fewer host updates belongs mainly to the host processor, communication bus, and interface logic. It should not be reported as a large panel-power reduction unless the panel current was measured and the driver actually changes its internal scan behavior.
Build Power Budget
The most reliable PMOLED estimate combines datasheet limits, a measured pattern model, and converter efficiency. Start with the exact module revision. Record whether the quoted current is typical or maximum, which rail it belongs to, the pattern, contrast setting, display voltage, temperature, and multiplex ratio.
Use the following sequence:
- List every supply rail and identify where its current will be measured.
- Set the final driver initialization values, including multiplex ratio, display clock, contrast, precharge, and grayscale table.
- Measure display-off current.
- Measure display-on all-black current.
- Measure several known pixel loads and grayscale fields.
- Measure the real product screens over time.
- Check the brightest allowed pattern at minimum battery voltage and maximum temperature.
- Apply converter efficiency at each measured load.
- Add host, regulator, sensor, and standby power.
- Use typical values for battery-life estimates and maximum values for supply sizing.
A useful empirical model separates fixed active-driver current from pattern-dependent current. Let the display-on black-screen current be the fixed baseline. The additional current above that baseline can be fitted against effective pixel load and contrast. Use at least three nonzero load points so that nonlinearity can be seen.
| Bench pattern | Reason | Use in model |
|---|---|---|
| Display off | Lowest operating mode | Sleep baseline |
| Display on, all black | Driver active with no intended emission | Fixed active baseline |
| 25% checkerboard | Low-to-medium uniform load | First slope point |
| 50% checkerboard | Common datasheet reference | Main comparison point |
| 75% checkerboard | High uniform load | Check nonlinearity |
| All white | Maximum uniform pixel load | Supply and thermal limit |
| Real worst screen | Highest intended product load | Product limit |
For early converter sizing, the published 50% checkerboard examples can be translated into battery-side estimates. The table below assumes converter efficiencies only for calculation. These efficiencies are not module specifications and must be replaced with the real converter curve.
| Module data point | Display-rail power | Assumed efficiency | Converter input power | Current at 3.7 V |
|---|---|---|---|---|
| 128 x 64, 12 V at 10 mA typical | 120 mW | 90% | 133.3 mW | 36.0 mA |
| 128 x 128, 12 V at 15 mA typical | 180 mW | 90% | 200.0 mW | 54.1 mA |
| 256 x 64, 14.5 V at 25 mA typical | 362.5 mW | 88% | 411.9 mW | 111.3 mA |
| 256 x 64, 16 V at 35 mA typical | 560 mW | 88% | 636.4 mW | 172.0 mA |
Do not treat typical current as a supply limit. Use the module maximum where provided, then add converter tolerance, temperature effects, aging, input-voltage range, and transient margin. The converter should support the peak row-current pulses without entering current limit even if its average output current appears sufficient.
For battery life, build a time profile. For example, separate screen-off time, display-on black time, normal UI time, and bright warning-screen time. Multiply each measured battery current by its share of operating time, add the other product loads, and calculate the weighted average. This is more reliable than assigning one pixel-on ratio to the entire product.
| Operating mode | Time share | Measured battery current | Weighted current |
|---|---|---|---|
| Screen off | Enter real value | Enter measured value | Time share x current |
| Idle screen | Enter real value | Enter measured value | Time share x current |
| Normal screen | Enter real value | Enter measured value | Time share x current |
| Bright warning | Enter real value | Enter measured value | Time share x current |
| Animation | Enter real value | Enter measured value | Time share x current |
The final report should state the exact pattern, driver setup, rail, measurement point, supply voltage, temperature, instrument bandwidth, and whether the result is average, RMS, or peak. Without these details, a current number cannot be safely reused in another design.
Hinterlasse einen Kommentar
Diese Website ist durch hCaptcha geschützt und es gelten die allgemeinen Geschäftsbedingungen und Datenschutzbestimmungen von hCaptcha.