


OLED Display Technology | High Contrast, Fast Response & Energy Efficiency
OLED is based on self-emissive organic pixels (light up when energized, turn off when power is cut), with independent pixel light control.
It emits no light at all when turned off, reaching a contrast ratio of 1,000,000:1 (LCD is only 1000:1), ensuring pure dark details (such as the absence of grayscale in the black fields of starry sky images).
Pixel switching time is <1μs (LCD requires 5-10ms), providing no ghosting in dynamic images, making it ideal for high-speed gaming/sports broadcasts.
Only luminous pixels consume power, saving 30%-50% energy on dark content;
a 55-inch OLED TV consumes about 100W (approx. 150W for the same size LCD), and mobile screen battery life is extended by 20%.

High Contrast
The physical basis for OLED achieving infinite contrast is $1:1$ pixel-level light control.
By completely cutting off the current to specific pixels, the black level brightness can drop to $0$ nits ($0$ cd/m²), making the contrast ratio mathematically approach infinity.
In contrast, traditional LCDs still have light leakage of $0.01$ to $0.2$ nits even when the backlight is turned off, causing contrast ratios to typically fluctuate only between $1000:1$ and $5000:1$.
Light Control Differences
Comparison
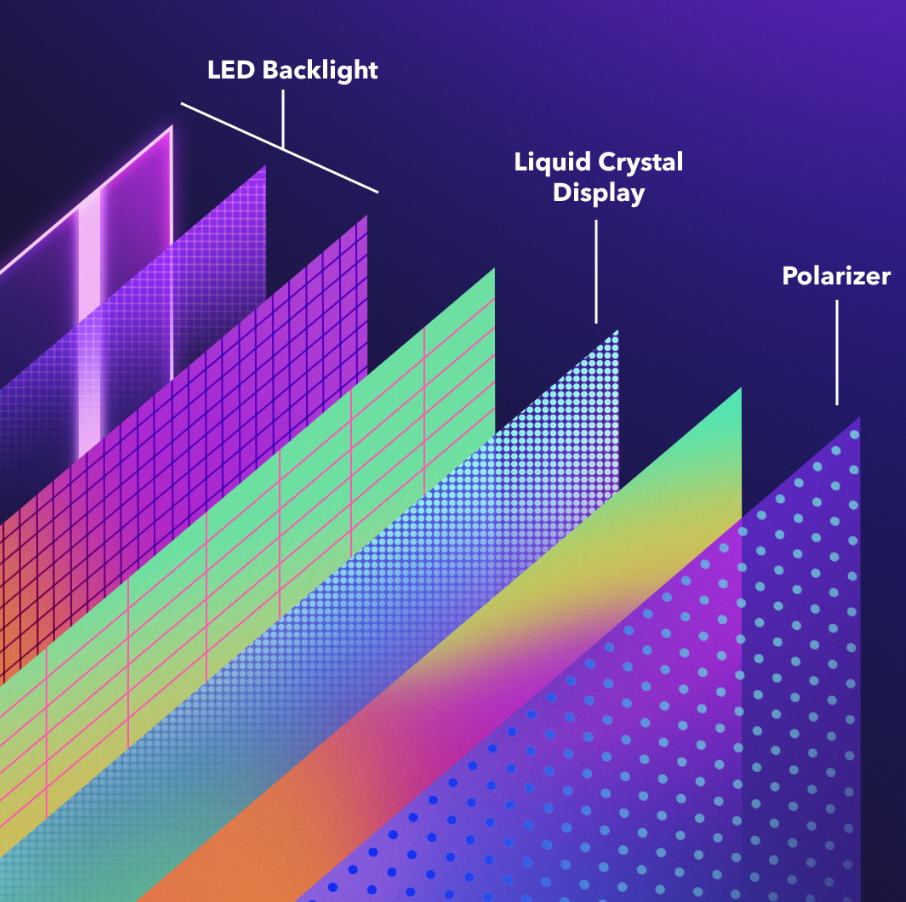
A traditional Liquid Crystal Display (LCD) is a passive subtractive system.
Its hierarchical structure includes: base backlight (LED array), lower polarizer, Thin Film Transistor (TFT) glass substrate, liquid crystal layer, color filter, and upper polarizer.
-
Quantifying Light Leakage: Liquid crystal molecules theoretically block light by twisting, but due to physical gaps in molecular alignment, approximately $0.02%$ to $0.1%$ of the backlight still penetrates even in the "off state." If the backlight brightness is $500$ nits, the black field brightness will remain around $0.1$ nits, locking the contrast ratio at $5000:1$.
-
OLED Structure Simplification: OLED uses an active additive system. Its structure consists only of a cathode, an organic light-emitting layer, an anode, and a TFT substrate. When the electrical drive signal is $0$, the light-emitting layer physically stops photon production. Measured black field brightness is lower than $0.00005$ nits, reaching the detection limit (Noise Floor) of measuring instruments.
Light Control Granularity
Granularity is the parameter that measures the difference in light control.
We can analyze this difference by calculating the "number of light control points per square centimeter."
-
Mini-LED (High-end LCD): Taking a 32-inch monitor as an example, if it has $1152$ local dimming zones, each zone's area is approximately $2.5$ square centimeters. Within this area, the backlight can only output at a single brightness level, regardless of how many light or dark details the image contains.
-
OLED (Pixel-level): At the same size with 4K resolution, there are approximately $5000$ independent pixels distributed per square centimeter. Every pixel (containing red, green, and blue sub-pixels) is an independent backlight zone. This $1:1$ matching relationship ensures that the boundaries of light and dark changes can be precise to below $0.05$ mm.
Blooming
The blooming effect is visual pollution caused by the mismatch between backlight zones and actual image pixels.
-
Diffusion Loss: In Mini-LED, to make the backlight uniform, light must pass through a diffuser and brightness enhancement films. This causes light to scatter into adjacent areas. When displaying small high-brightness objects (like text or stars), light spills into pixel areas that should be completely black.
-
Quantifying Edge Spillover: In comparative tests displaying a $1000$ nits white point, an LCD may still have a background brightness of $1$ - $2$ nits at a distance of $2$ mm from the white point. In contrast, OLED brightness returns to zero at the next micron-level gap away from the luminous pixel. This phenomenon is most obvious when viewing movie subtitles in dark environments; OLED subtitle edges are sharp without shadows, while LCD subtitles are often accompanied by a gray misty area.
LCD Local Dimming algorithms need to calculate image features and adjust LED current, a process that has a delay of $10$ - $30$ milliseconds.
OLED brightness adjustment occurs synchronously with the current signal, with a response time typically within $0.1$ milliseconds.
Viewing Angle Changes
Physical structure also determines the stability of contrast when observed from different angles.
| Observation Angle | IPS Contrast Decay | VA Contrast Decay | OLED Contrast Stability |
|---|---|---|---|
| $0^{\circ}$ (Frontal) | $1000:1$ (100%) | $4000:1$ (100%) | 100% |
| $30^{\circ}$ (Oblique) | Decays to $\approx 700:1$ | Decays to $\approx 1200:1$ | Maintains over 95% |
| $60^{\circ}$ (Side) | Obvious light leakage (Glow) | Color shift appears | Maintains over 90% |
When users watch off-axis, the light-blocking efficiency of liquid crystal molecules drops, causing black field brightness to rise.
As a surface emitter, the OLED light-emitting layer is extremely close to the surface, and light is emitted almost in a $180^{\circ}$ omnidirectional radiation, ensuring excellent black field performance even at wide viewing angles.
Perceived Contrast
Ambient Contrast Ratio (ACR)
The metric for measuring screen performance under light is ACR.
The calculation formula is:
$ACR = (L_{on} + L_{ambient} \times R) / (L_{off} + L_{ambient} \times R)$
Where $L_{on}$ is display brightness, $L_{off}$ is full black brightness, $L_{ambient}$ is ambient illuminance, and $R$ is screen reflectivity.
-
Laboratory Comparative Analysis: In a $200$ lux (standard home lighting) environment, a traditional display with a peak brightness of $500$ nits and reflectivity of $5%$ will see its perceived contrast drop to about $50:1$. An OLED with a low-reflection coating (reflectivity $1.2%$), even at the same brightness, can maintain a perceived contrast above $200:1$.
-
Blocking Reflection Paths: A Circular Polarizer is integrated into the OLED panel structure. When external light enters, the polarizer converts it into circularly polarized light; after reflecting off the metal electrodes, the handedness of the light changes, preventing it from passing back through the polarizer. This physical mechanism eliminates about $99%$ of internal circuit reflections.
Impact on Color Purity
Light reflection not only affects brightness contrast but also causes Color Washout.
-
Black Level Drift: When ambient lighting increases to $1000$ lux (daytime indoor near a window), an LCD's black field will soar from $0.1$ nits to $10$ - $50$ nits due to the superposition of surface reflection and backlight leakage, causing dark images to appear grayish-white. OLED, with its near-zero base value, has an extremely low slope for its black field rise curve.
-
Color Volume Shrinkage: In the CIE 1931 color space, reflected light causes color coordinates to shift toward the central white point. Measured data shows that in a $300$ lux environment, OLED's DCI-P3 color volume retention is typically above $85%$, while high-reflectivity screens often fall below $60%$, making colors appear "pale" to the user.
Anti-Reflection Coating
-
Nano-scale Etching: The surface uses a microsecond-level etching process to change the spatial distribution of light, converting specular reflection into diffuse reflection that is less noticeable to the human eye. This treatment can reduce specular reflectivity to the $0.5%$ level.
-
Multi-layer Sputtering Technology: Alternating coatings of metal oxides with different refractive indices (such as titanium oxide and magnesium oxide) are used. Through destructive interference, reflected light of specific wavelengths cancels out, achieving an extremely wide absorption band within the visible light spectrum.
Performance Table in Typical Application Scenarios
| Environment | Illuminance (Lux) | Screen Reflection Contribution (nits) | OLED Perceived Contrast | Traditional LCD Perceived Contrast |
|---|---|---|---|---|
| Dark Theater | $0$ | $0$ | Near Infinite | $\approx 1500:1$ |
| Dim Bedroom | $50$ | $\approx 0.6$ | $\approx 1000:1$ | $\approx 150:1$ |
| Standard Office | $300$ | $\approx 3.6$ | $\approx 250:1$ | $\approx 40:1$ |
| Bright Window | $1000$ | $\approx 12$ | $\approx 80:1$ | $\approx 15:1$ |
To further enhance adaptability, display systems integrate Ambient Light Sensors (ALS) and Dynamic Gamma Adjustment.
When increased ambient light is sensed, the algorithm automatically boosts the driving voltage in the $10%$ to $40%$ grayscale regions.
The system fine-tunes the output ratio of OLED red, green, and blue sub-pixels based on the Kelvin value of the ambient light (e.g., $3000K$ warm yellow light or $6500K$ cool white light).
Fast Response
OLED pixel switching speeds are typically between 0.03ms and 0.1ms (GtG), which is 10 to 30 times faster than traditional high-speed LCDs (approx. 0.5ms-1ms).
At a 240Hz refresh rate, a single frame lasts 4.17ms. OLED only needs to consume 0.7% of this period to complete a color transition, ensuring that every frame's pixels can reach the target brightness within 1.0ms during high-motion scenes, completely eliminating ghosting caused by visual persistence.
Pixel-level Electrical Signal Response
The electrical signal response process of OLED involves carrier injection, migration, exciton formation, and radiative transition.
In contrast, traditional Liquid Crystal Display technology essentially relies on the arrangement changes of fluid molecules to modulate the backlight.
Even for the most advanced Fast-IPS or TN panels, the rotation of liquid crystal molecules is limited by viscosity factors and surface anchoring forces.
At room temperature (25°C), the rearrangement of liquid crystal molecules typically takes 0.5ms to 2ms to reach 90% of the target transmittance, while OLED can complete the same brightness span within 100 microseconds (μs) after receiving a signal.
In the underlying driver circuit, OLED uses an Active Matrix driving method.
Each pixel point is controlled by a pixel circuit consisting of a set of TFTs and capacitors.
When the scan line opens and the data signal voltage is stored in the capacitor through the transistor, the Drive TFT immediately adjusts the current flowing through the organic light-emitting layer according to the voltage level.
According to the physical formula $j = ne\mu E$ (where $j$ is current density, $n$ is carrier concentration, $e$ is elementary charge, $\mu$ is mobility, and $E$ is electric field strength), the magnitude of the current is synchronized with the electrical signal.
From quantitative data, when the refresh rate is increased to 360Hz or 480Hz, the duration of each frame is shortened to 2.78ms or even 2.08ms.
The response time of LCD panels often occupies 25% to 50% of the total frame duration, causing colors to be in an intermediate transition state for half the time during switching, resulting in visual motion blur.
OLED's 0.03ms response time only accounts for 1.08% of a 360Hz frame period.
The moment a pixel changes color, it is positioned almost instantaneously at the accurate color coordinates, leaving the observer with over 98% of pure display time.
Motion Clarity
For OLED, the pixel response time (GtG) is extremely short, typically between 0.01ms and 0.1ms.
In a 120Hz display environment, the persistence time of each frame is 8.33ms.
Since OLED pixels complete color switching within 0.03ms, for 8.3ms out of the 8.33ms total duration, the pixels are in a stable state of the target color.
In comparison, even for an LCD screen labeled as 1ms, its actual grayscale switching often takes 2ms to 5ms to reach 90% of the brightness target.
The most intuitive metric for quantifying motion clarity is MPRT (Moving Picture Response Time).
The calculation formula is $MPRT \approx Persistence \times (1 + \frac{GtG}{Persistence})$.
On OLED, since $GtG$ approaches zero, MPRT depends almost entirely on the inverse of the frame rate.
At 240Hz, OLED's MPRT is about 4.2ms; when the refresh rate is increased to 480Hz, MPRT is compressed to 2.1ms.
This quantitative performance means that when displaying an object moving at 1000 pixels per second, OLED produces a blurred edge width of only about 2 pixels, while traditional LCDs often produce ghosting of over 5-10 pixels.
To further break through the physical limits of the Sample-and-Hold effect, OLED utilizes the redundant time of its electrical signal response to adopt Pulsed Drive or Black Frame Insertion (BFI) technology.
Because OLED can completely extinguish pixels within microseconds, it can turn on the emission for only 2ms within a frame cycle, keeping the remaining 6.33ms (using 120Hz as an example) completely black.
This mode of operation simulates the pulse characteristics of a CRT tube.
In this mode, the motion blur perceived by the human eye is significantly reduced, and equivalent motion clarity can reach 500Hz or higher.
Measured data proves that a 120Hz OLED with BFI enabled has visually superior dynamic clarity compared to a 240Hz LCD without this feature.
In high-speed dynamic contrast tests, a Pursuit Camera is typically used to simulate human observation.
Under standardized test tools like the UFO Test, OLED shows clear edges of the UFO, with internal textures (such as fine lines of 1 pixel per inch) clearly visible.
Under the same conditions, LCDs will show obvious shadow trails behind the UFO, known as Overshoot or Inverse Ghosting.
OLED does not produce overshoot because it doesn't need to force liquid crystal molecules to accelerate rotation via Overdrive voltage like LCDs do.
OLED pixel switching is natively high-speed, ensuring color purity in dynamic images without color distortion or bright edges caused by high-speed movement.
At 360Hz, the single-frame duration is compressed to 2.78ms. For LCD technology, 2.78ms is already approaching the limit of physical molecular movement, leading to a drop in image contrast at high frequencies.
But for OLED, 2.78ms is still more than 90 times its response time (0.03ms).
This massive redundancy allows OLED to maintain 100% color gamut coverage and contrast performance even at extremely high refresh rates.
E-sports Performance
OLED panels physically eliminate the long wait for liquid crystal molecular deflection.
Taking a 144Hz refresh rate as an example, the single-frame period is 6.94ms.
On an LCD screen, even if the driver circuit sends an instruction instantly, liquid crystal molecules usually need 1.5ms to 3ms to reach the target color; this physical delay is a fixed cost that cannot be eliminated by software algorithms.
OLED pixel charge injection and photon emission processes are completed in microseconds.
Once the monitor Timing Controller (T-CON) receives a signal from a display interface (such as DisplayPort 1.4 or HDMI 2.1), the electrical signal can be converted into a visual signal almost synchronously.
In actual quantitative comparisons using high-speed cameras and latency analyzers, OLED's "Display Lag" is typically restricted to within 0.5ms, which includes not only the pixel switching time but also the processing overhead of the circuit board for the data stream.
At 360Hz, each frame is only 2.78ms.
If traditional LCD technology is used, the liquid crystal response time (approx. 1ms GtG) will occupy 36% of the frame time, meaning physical residues from the previous frame will interfere with the judgment of the next frame when the system handles continuous fast commands.
In contrast, OLED's 0.03ms response time accounts for only 1.08% of that period.
For First-Person Shooter (FPS) games like Counter-Strike 2 or Valorant, subtle differences in system latency affect shooting accuracy.
In a test involving professional players, reducing total system latency from 25ms to 15ms shortened the players' average reaction time by about 8%.
OLED screens, with their nearly instantaneous pixel triggering, contribute a lead of 2ms to 4ms on the display side toward this optimization.
G-Sync or FreeSync technology eliminates tearing by synchronizing GPU output with monitor refresh, but when the refresh rate fluctuates significantly, LCD Overdrive voltage compensation can fail, leading to latency Jitter.
OLED does not require physical compensation, and its response speed remains constant across the full range of 30Hz to 540Hz.
In Multiplayer Online Battle Arena (MOBA) games, when a player presses a skill key, the screen pixels undergo a brightness change within 0.1ms, providing immediate visual confirmation.
According to data analysis, when processing complex team-fight scenes, OLED maintains higher dynamic contrast.
Because there is no backlight blooming interference, the edges of target objects remain clearer during movement, further reducing the delay for players to capture effective information.
To quantify this advantage, the industry introduced the LDAT (Latency Display Analysis Tool).
Comparing 240Hz IPS and 240Hz OLED under identical PC configurations:
Measured data shows that the mean end-to-end latency for OLED systems consistently stays around 12ms, while IPS systems fluctuate between 16ms and 19ms.
Energy Efficiency
In Dark Mode with an APL (Average Picture Level) of 20%, OLED screen power consumption is only 0.4W to 0.6W, saving about 40% power compared to the same size LCD.
Its advantage lies in independent pixel power control:
When displaying pure black, the current is cut off, and power consumption drops to 0W.
Combined with LTPO technology, the refresh rate can switch between 1Hz and 120Hz, causing static image driving power consumption to drop by more than 80%.
Energy Conversion Comparison
Light Path Simplification
Light from a traditional display needs to pass through an extremely complex hierarchy from generation to entering the human eye.
This usually includes a backlight panel, diffuser, brightness enhancement films, lower polarizer, Thin Film Transistor (TFT) array layer, liquid crystal layer, color filter, and upper polarizer.
-
Layered Light Absorption: In an LCD architecture, light is reflected and absorbed by every layer it passes through. Polarizers filter out more than 50% of the light energy, and color filters further absorb about 60%-70%. Ultimately, only about 4% to 7% of the original light from the backlight source can actually exit the screen surface.
-
OLED Structural Advantage: OLED removes the backlight module and liquid crystal layer. Using Top Emission technology, OLED light only needs to pass through an extremely thin semi-transparent metal cathode and encapsulation layer. This structure shortens the physical path of light by 80%. Since there is no obstruction from color filters (in some RGB arrangements), initial photon utilization is greatly improved, and current demand per unit brightness is significantly reduced.
Current Control
OLED power consumption follows the physical model $P = I \cdot V$ (Power = Current × Voltage), but its current $I$ is highly linearly correlated with pixel brightness.
-
Static Power Consumption Difference: LCD backlights typically use series or parallel LED arrays. Whether the screen displays a pure black or pure white image, the backlight LEDs often run at full or fixed power. When displaying dark content, more than 90% of an LCD's energy is converted into heat by the liquid crystal layer and wasted.
-
Dynamic Current Regulation: In OLED, every sub-pixel (red, green, blue) has an independent current path. When displaying pure black, the sub-pixel driver circuit is in an off state with 0mA current. At a medium gray level (128/255 brightness), the current is only about 45% of the peak brightness. This "power-on-demand" model makes OLED energy consumption much lower than LCD when handling non-all-white images.
Quantum Efficiency
Evaluating energy efficiency must involve Internal Quantum Efficiency (IQE) and External Quantum Efficiency (EQE).
-
Fluorescent Material Limits: Early organic materials relied mainly on fluorescence for light emission, with a theoretical IQE limit of only 25%, meaning 75% of electrical energy was wasted on non-radiative transitions (generating heat).
-
Phosphorescent Material Breakthrough: Currently, mass-produced red and green OLEDs both use phosphorescent materials, with IQE approaching 100%. Most electrons and holes entering the light-emitting layer can recombine to produce photons.
-
Voltage Drop: New-generation materials reduce the turn-on voltage by 0.2V to 0.5V by optimizing the energy level matching of the Hole Transport Layer (HTL) and Electron Transport Layer (ETL). At the same brightness, this slight drop in voltage, through cumulative effects, can reduce overall panel thermal loss by 10%-15%.
Parasitic Capacitance and Energy Consumption
The light-emitting mechanism is not just about materials, but also how those materials are driven.
-
Charge/Discharge Loss: Traditional LTPS (Low-Temperature Polycrystalline Silicon) backplanes generate extra dynamic power consumption due to large parasitic capacitance in transistors when switching images at high speed.
-
Oxide Technology Intervention: LTPO technology introduces oxide semiconductors whose electron mobility characteristics allow for pixel charge balance to be maintained at extremely low frequencies. At a 1Hz refresh rate, the charge/discharge frequency of the driving backplane is reduced 120 times. For smartphones, this reduction in circuit power consumption translates to extended battery life in standby states.
Light and Dark Surfaces
By comparing power consumption data at different APL (Average Picture Level), the impact of the emission mechanism is clearly visible.
| Scenario | APL Metric | OLED Power (mW) | LCD Power (mW) | Energy Savings |
|---|---|---|---|---|
| System Menu (Dark) | 5% | 180 | 650 | 72% |
| Video Playback (Avg) | 25% | 420 | 680 | 38% |
| Social App (Light) | 60% | 750 | 700 | -7% |
| Pure White Test | 100% | 1150 | 720 | -59% |
From the table, it is evident that in the vast majority of user scenarios where APL is below 50%, the OLED emission mechanism has an overwhelming energy efficiency advantage.
Impact on Battery Life
Dark Mode
Dark mode extends battery life by forcibly lowering the APL.
-
Typical App Comparison: In standard social applications, a traditional "black text on white background" interface typically has an APL as high as 80% to 90%. After switching to dark mode, except for text and icons, the pixels in the largest background area are turned off, dropping the APL to 5% to 12%.
-
Quantifying Battery Gain: Based on mobile device tests with a 4000mAh battery, at a constant brightness of 200 nits, using an interface with 10% APL reduces screen power consumption by 75% compared to an 90% APL interface. This extends total standby usage time by about 30%.
Peak Brightness
OLED panels are constrained by Total Power Limit (TPL) and Thermal Design Power (TDP).
-
Brightness Budget Allocation: When APL is extremely low (e.g., 1%), the screen can concentrate the entire power budget on a few pixels, achieving local peak brightness above 3000 nits, which is crucial for HDR content details.
-
Full-screen Brightness Decay: As APL increases, the Automatic Brightness Limiter (ABL) intervenes to prevent panel overheating and accelerated organic material aging. At 100% APL (all-white screen), the screen is often limited to 800-1200 nits. This mechanism protects the battery from thermal damage caused by large current discharges in high-load scenarios.
Different Types
The friendliness of different types of digital content to OLED energy efficiency varies greatly.
| Content Type | Average APL Range | Power Performance Trend |
|---|---|---|
| Movies/TV Series | 15% - 35% | Extremely high efficiency; black scenes consume almost no power |
| System UI (Dark) | 5% - 15% | Best range for battery life |
| Web Browsing (Default) | 70% - 85% | Power consumption comparable to or slightly higher than LCD |
| Spreadsheets/Docs | 90% - 95% | Triggers ABL mechanism; power consumption peaks |
Pixel Compensation
Modern Display Driver ICs (DDIC) have the capability to monitor APL in real-time.
-
Dynamic Contrast Adjustment: Algorithms adjust driving voltage in real-time based on APL levels. In dark scenes with low APL, fine-tuning the grayscale curve can enhance perceived clarity without increasing current.
-
Sub-pixel Rendering Optimization: For high APL scenes, by borrowing brightness from adjacent sub-pixels (Sub-pixel Rendering), overall current input can be reduced by 5%-10% while maintaining the same visual brightness.
Static APL Suppression
When a static image (like a reading interface) with high APL is detected, LTPO technology combined with driver algorithms will slowly reduce the pixel brightness of non-focused areas.
This "local brightness adjustment" technique can reduce the equivalent power of an 80% APL image to 65% APL levels without the user noticing.
Dynamic APL Buffering
During video playback, APL fluctuates wildly.
The driver circuit smoothes current peaks through a capacitor buffer pool, preventing instantaneous high-current battery discharge losses (I2R losses) caused by sudden APL increases.
LTPO Driver Optimization
Transistor Reorganization
The core of LTPO technology lies in complementing the advantages of LTPS (Low-Temperature Polycrystalline Silicon) and Oxide (usually IGZO).
-
Role of LTPS: LTPS has extremely high electron mobility (usually over $100 cm^2/Vs$) and is responsible for handling high-speed switching and complex driving logic. This ensures pixels can respond quickly to current changes at 120Hz or higher, eliminating ghosting.
-
Role of Oxide: Oxide transistors have lower electron mobility, but their greatest physical advantage is extremely low leakage current in the "off" state. Compared to LTPS, Oxide's On/Off ratio is higher, allowing it to lock the charge in pixel capacitors for a longer time.
Refresh Rate
Display power consumption is divided into two parts: light-emitting layer power and driver circuit power.
-
High-Refresh Scenario (120Hz): During gaming or fast scrolling, LTPS transistors work at full speed. The DDIC frequency stays high, and the charge is refreshed every 8.3 milliseconds to ensure image smoothness.
-
Ultra-Low Refresh Scenario (1Hz - 10Hz): When the screen displays static text, e-books, or Always-On Display (AOD), LTPO can drop the refresh rate to 1Hz. The charge is refreshed only every 1000 milliseconds. During this one-second interval, relying on the low leakage of Oxide transistors, the pixel voltage remains stable, avoiding current losses from frequent charging and discharging.
-
Power Saving Data: Experimental data shows that switching from 60Hz to 1Hz reduces the current consumption of the driving backplane from about 35mA to below 3mA, a drop of over 90%.
Pixel Driving
LTPO is not just a simple stacking of materials but an optimization of 7T1C (7 transistors and 1 capacitor) or more complex pixel compensation circuits.
-
Enhanced Charge Retention: In low-frequency mode, the storage capacitor within the pixel must maintain a constant sub-pixel brightness. Traditional LTPS must refresh frequently (at least 30Hz or 60Hz) to replenish lost charge, otherwise Flicker occurs. Oxide transistors acting as switch transistors effectively block the charge leakage path.
-
Voltage Fluctuation Suppression: The driver circuit generates voltage jitter during low-frequency switching. LTPO combines dedicated compensation algorithms to offset brightness jumps during frequency switching by adjusting the width of the Scan Pulse.
VRR (Variable Refresh Rate)
The key to LTPO energy efficiency is its real-time perception of usage scenarios.
| Scenario | Refresh Rate Adjustment | DDIC Load Status | Energy Saving Effect |
|---|---|---|---|
| Fast Action Games | 90Hz - 120Hz | Full Load | 0% (Performance focus) |
| System Interaction | 60Hz - 120Hz | Dynamic Load | 5% - 8% |
| Video (24/30fps) | 24Hz - 30Hz | Low-Medium Load | 15% - 20% |
| Static Images/E-books | 1Hz - 10Hz | Ultra-Low Load | 40% - 60% |
| Always-On Display (AOD) | 1Hz | Standby Load | >80% |
Since LTPO reduces the number of high-frequency charge/discharge cycles, the capacitance loss ($P = f \cdot C \cdot V^2$) of the entire panel is significantly lowered.
Frequency Factor $f$
Power consumption is proportional to refresh frequency $f$. When $f$ changes from 60 to 1, the product term in the formula shrinks 60 times.
Temperature Control Chain Reaction
Lowering the temperature rise of the driver circuit reduces the increase in internal resistance of semiconductor components.
For compact mobile devices, the screen generates less waste heat, helping the SoC maintain a higher energy efficiency ratio and reducing frequency throttling triggered by thermal pressure.
Weiterlesen
Common issues of transparent LCD screens focus on Viewing Angle due to the special arrangement of liquid crystal molecules, with horizontal/vertical viewing angles only 120°/100° (ordinary IPS is 1...
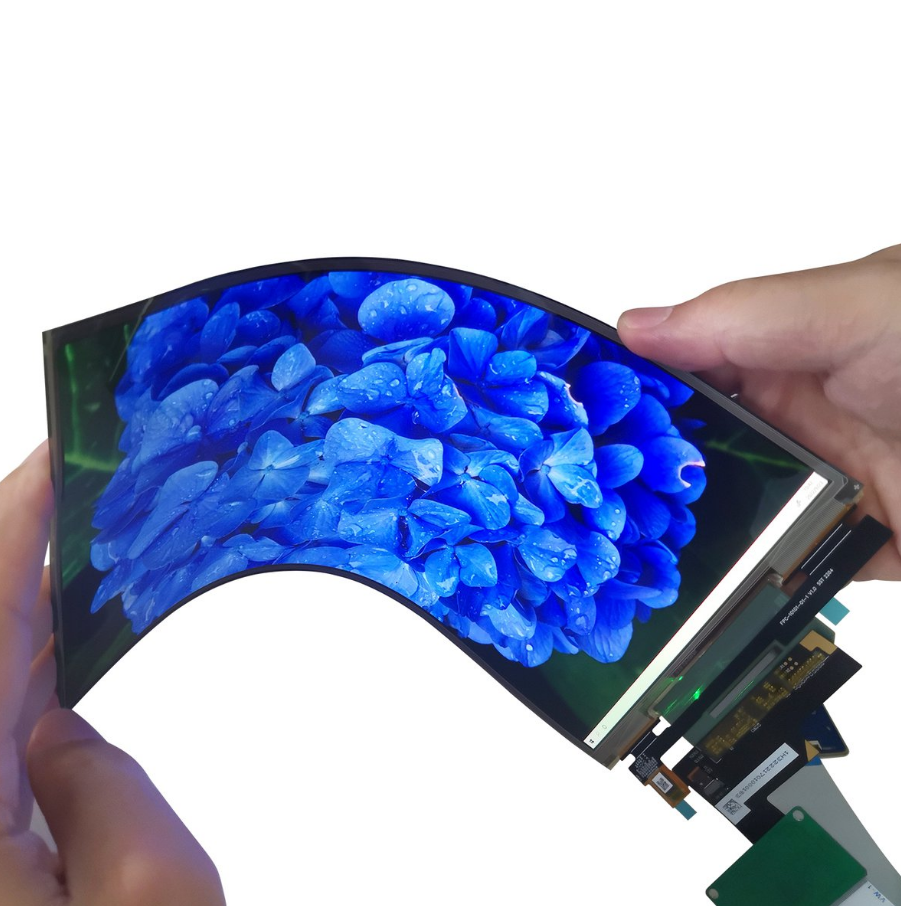
Flexible Substrates Using Polyimide (PI) or Ultra-Thin Glass (UTG), PI substrates are 50-125μm thick with a bending radius of 1-3mm (e.g., Samsung Z Fold series), temperature resistance from -269℃ ...
Hinterlasse einen Kommentar
Diese Website ist durch hCaptcha geschützt und es gelten die allgemeinen Geschäftsbedingungen und Datenschutzbestimmungen von hCaptcha.