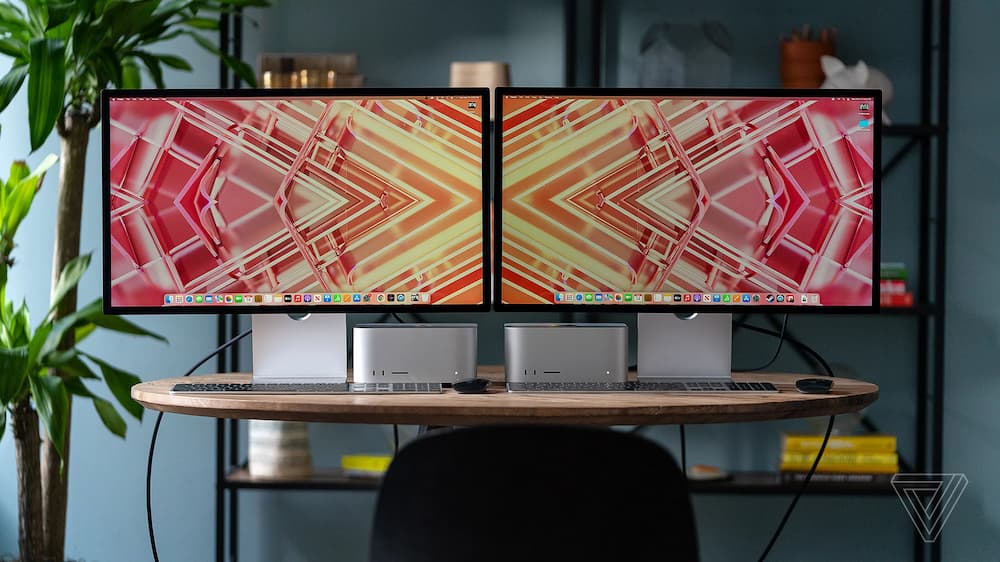
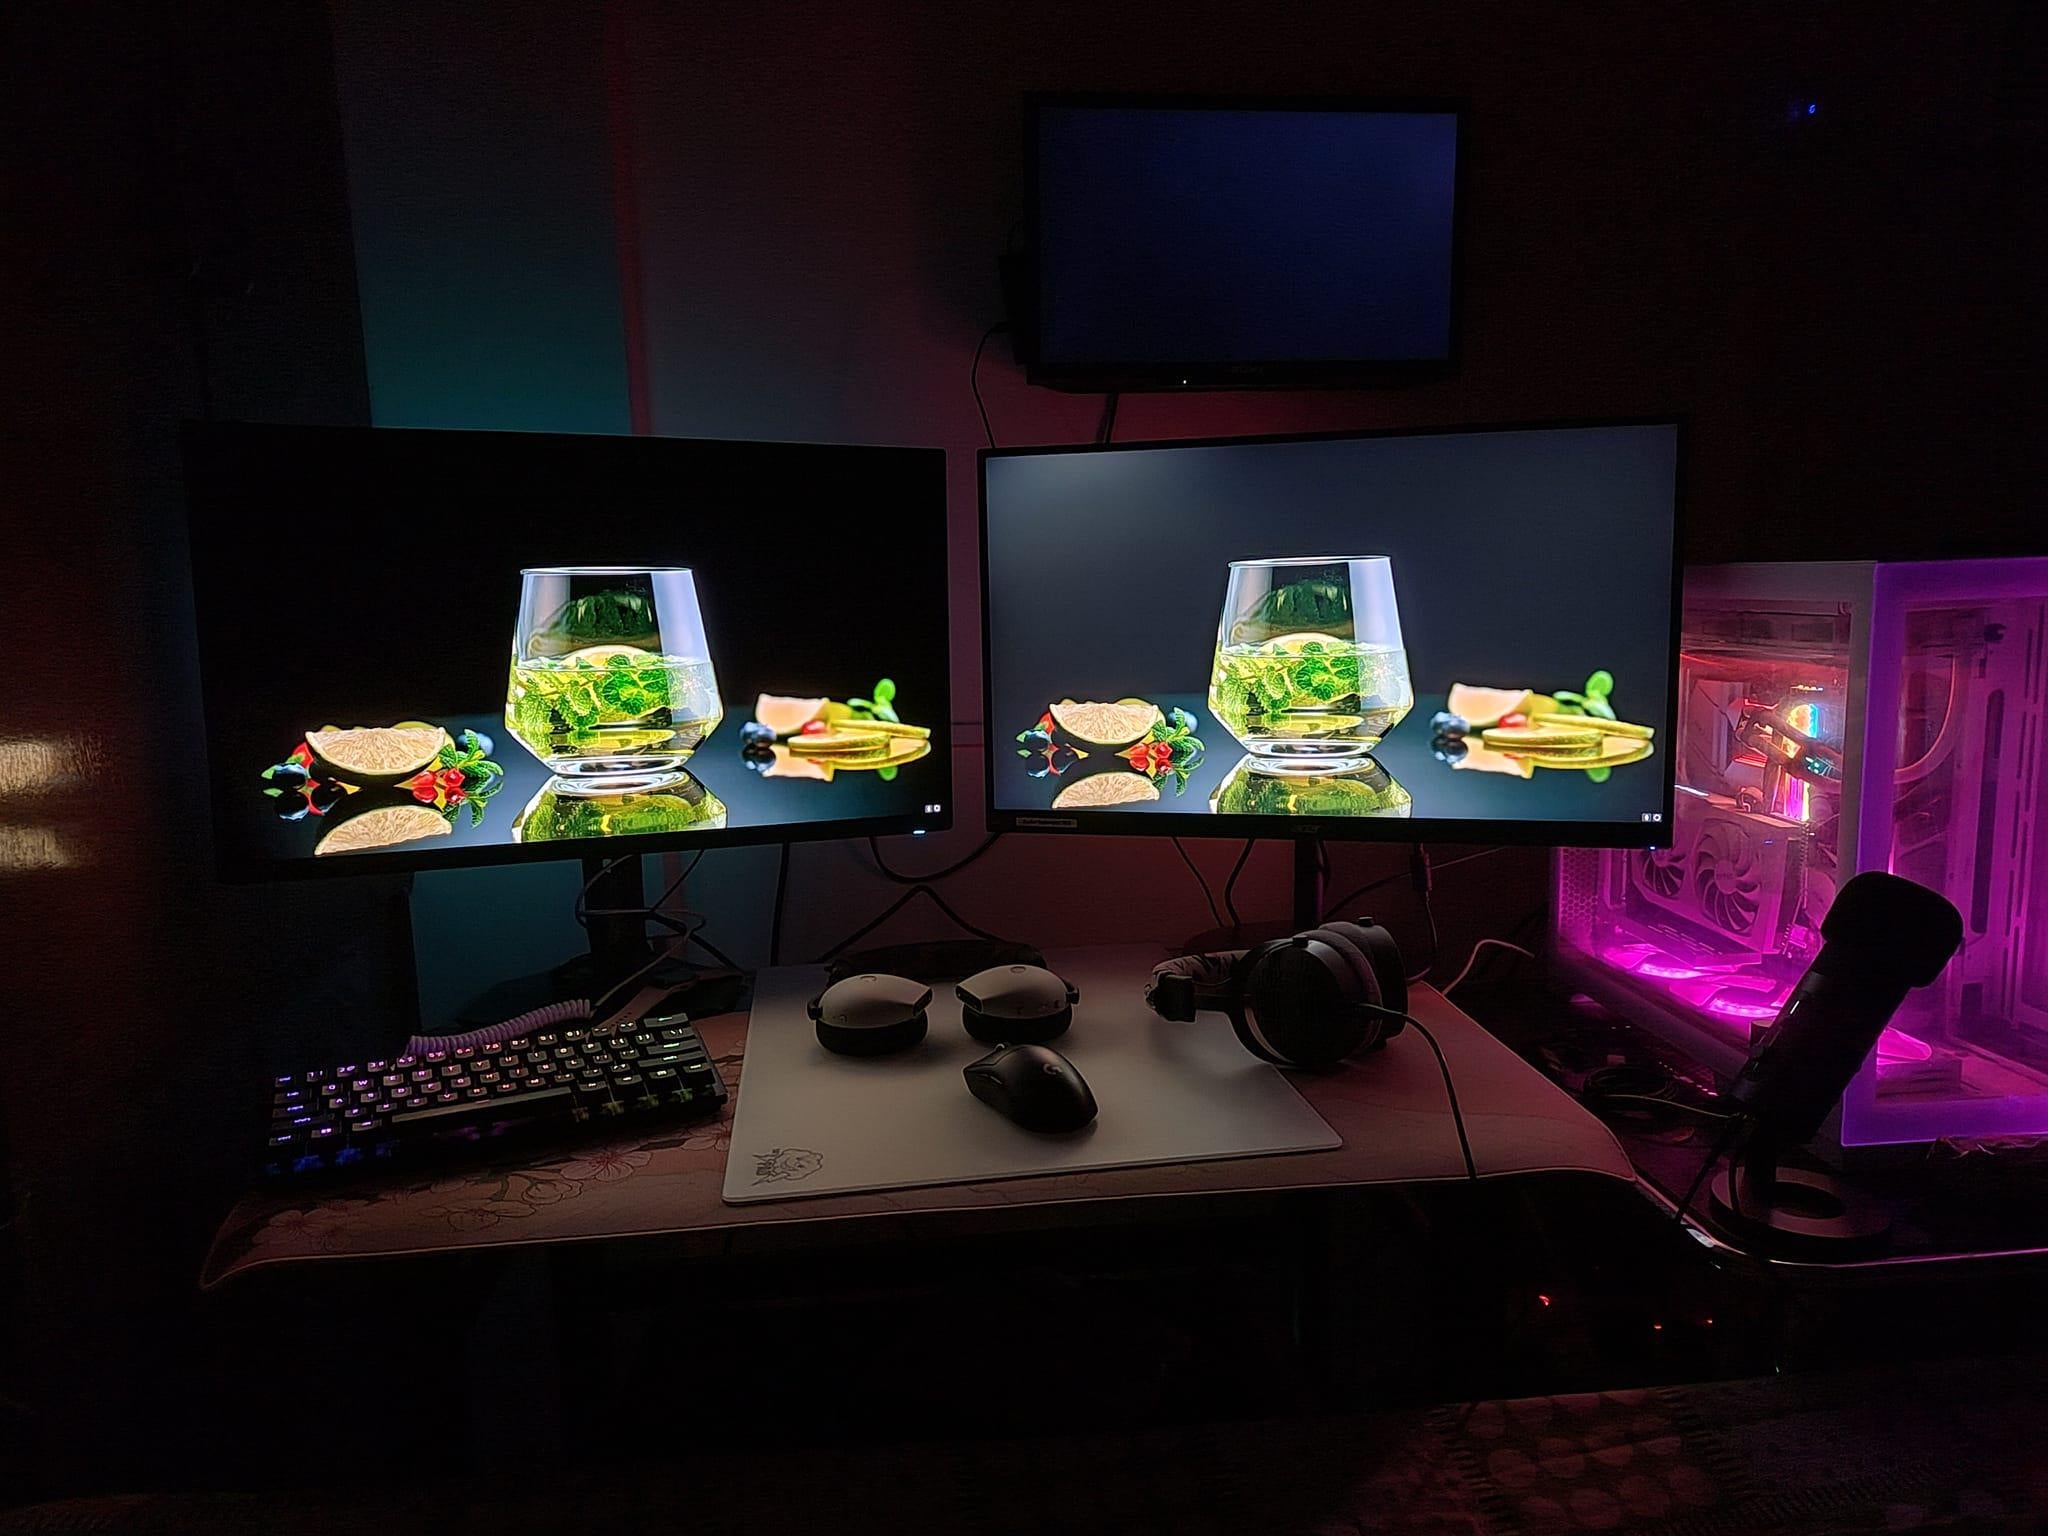
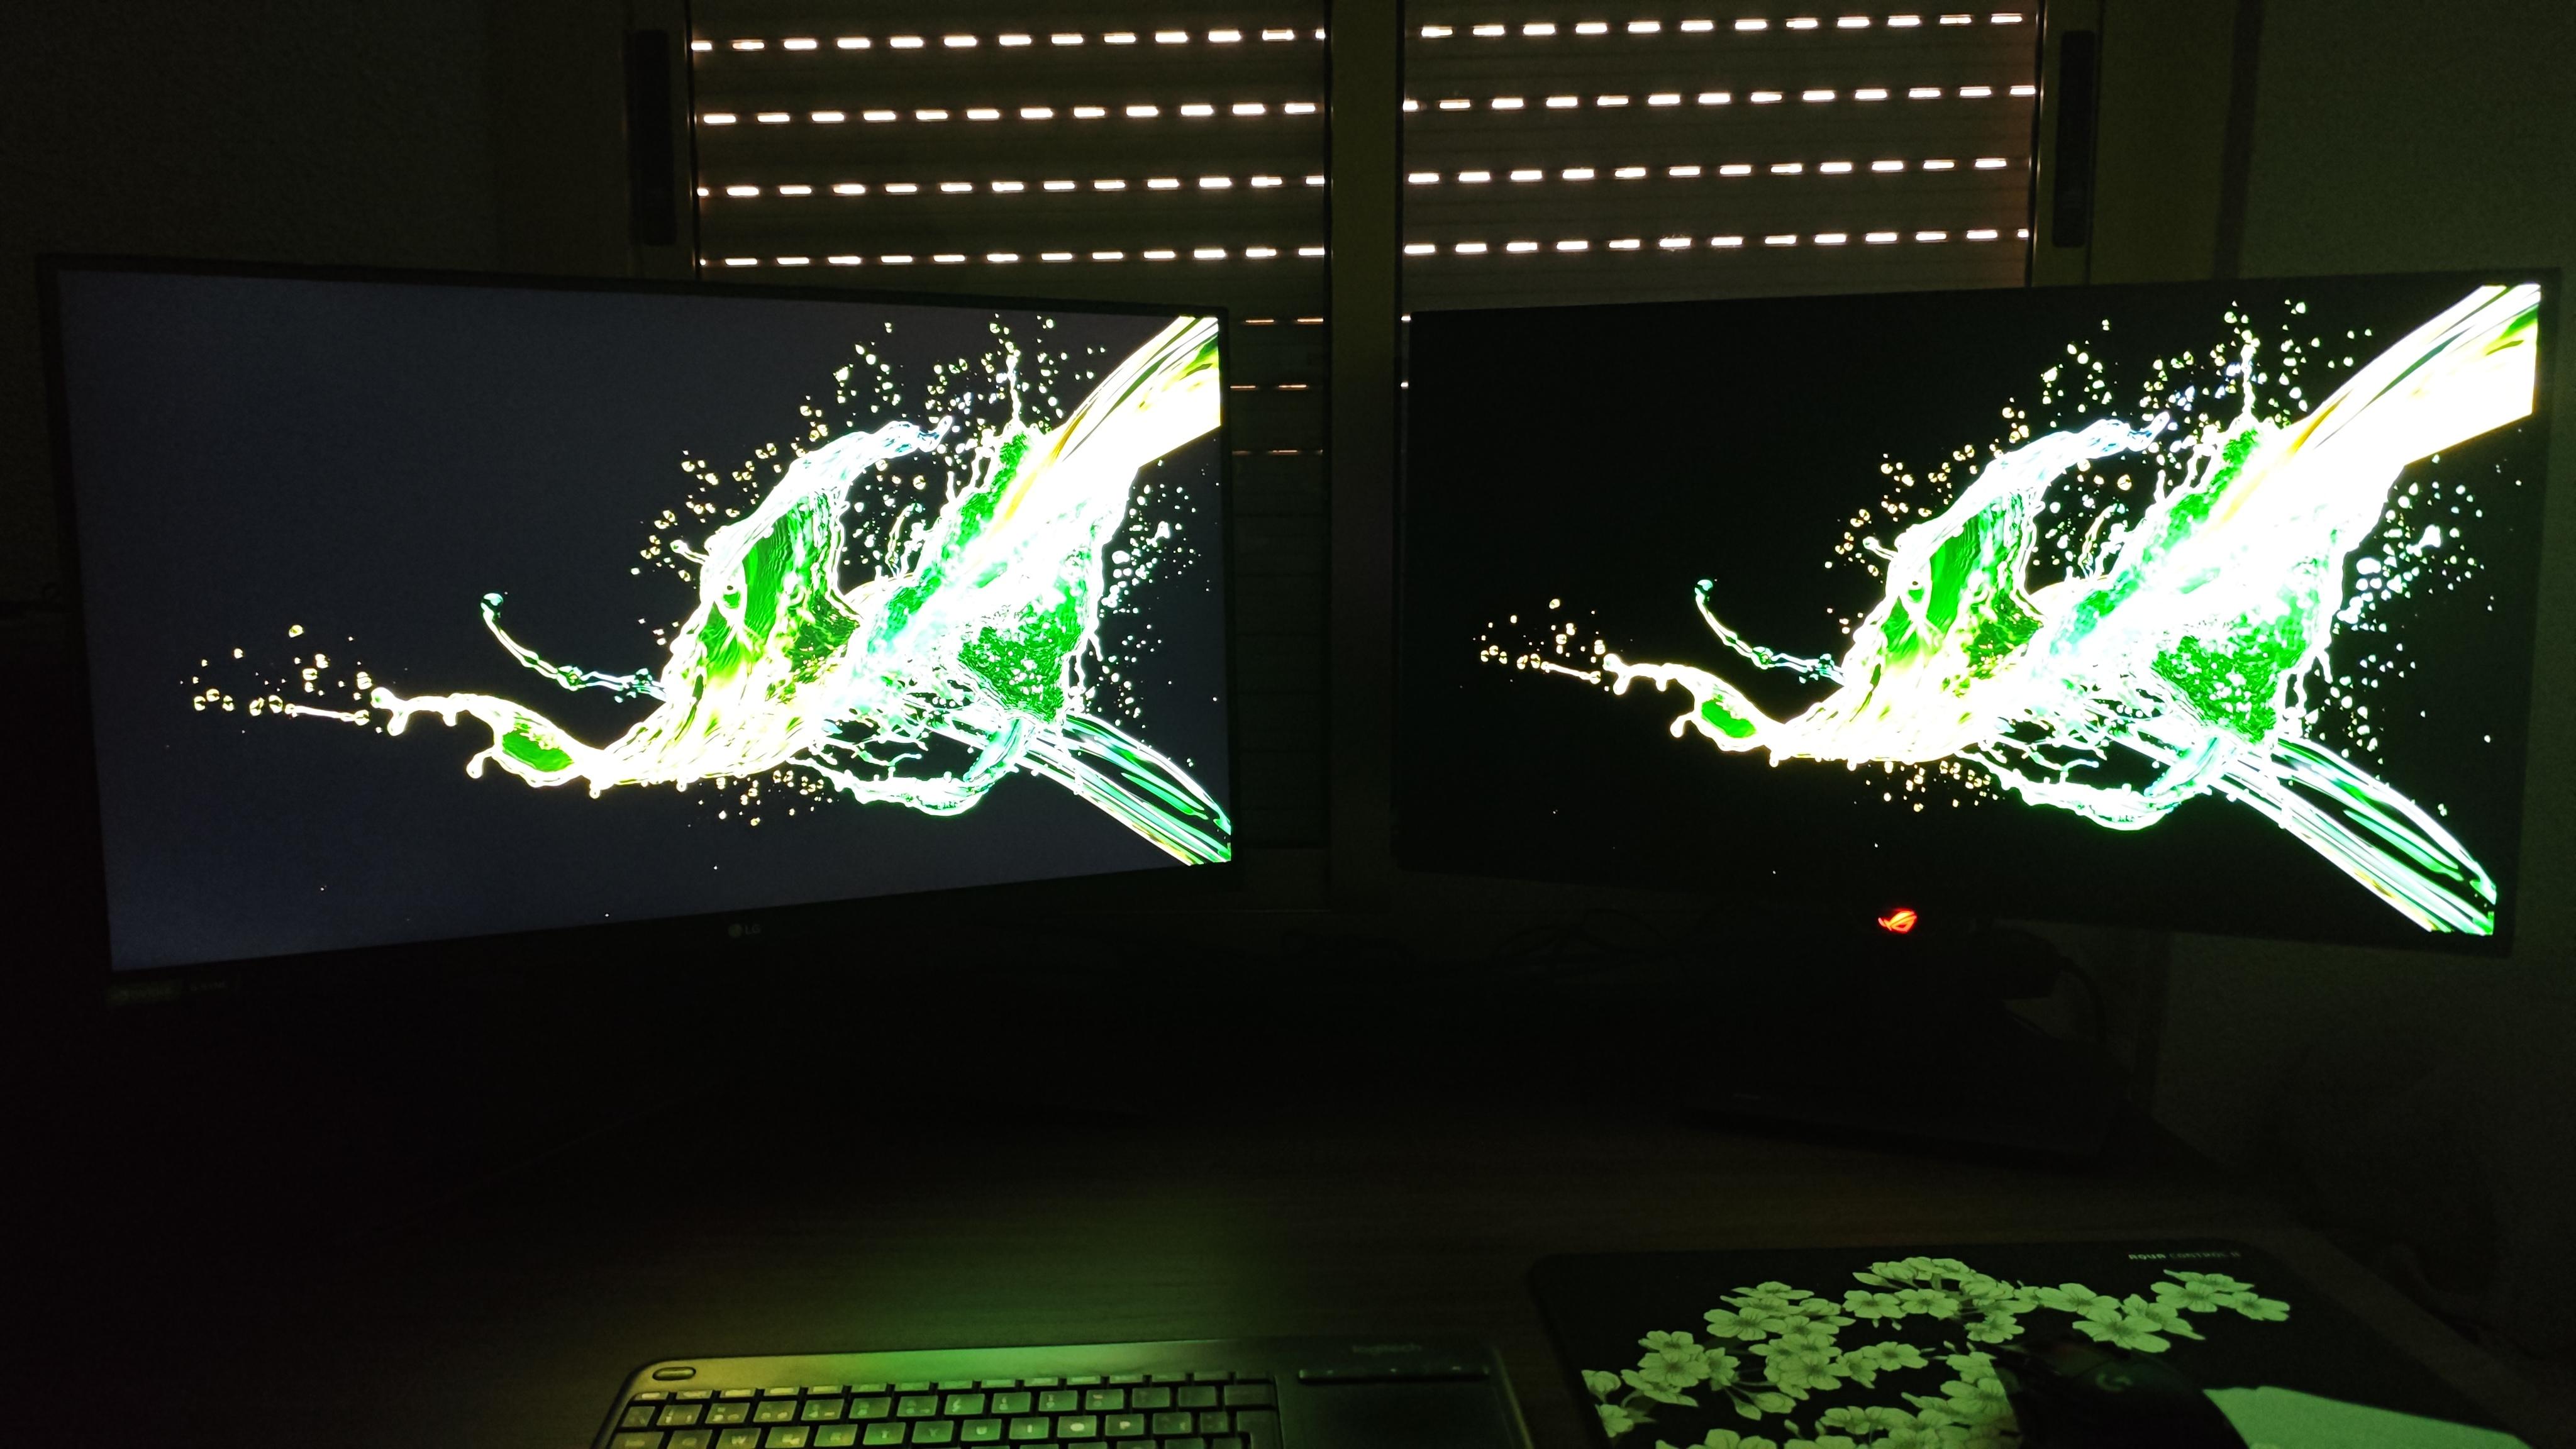
To test an IPS panel’s quality, start by measuring its contrast ratio (ideally 1000:1–1440:1) with a brightness meter, then check response time (target ≤5ms) using fast-moving visuals to spot ghosting; evaluate viewing angles (178° horizontal/vertical) by observing color shifts from off-center positions, and validate color accuracy (ΔE <2) via a colorimeter to ensure minimal deviation from standard palettes.
Checking Viewing Angles
Unlike TN panels (which start distorting at just 100–120°), IPS is marketed as having “wide” angles (178° horizontal/vertical), but real-world performance varies. Here’s how to test it properly, with hard numbers.
First, set up a controlled environment: use a 500 lux ambient light (similar to office lighting) to mimic daily use, and position the panel at a 100° tilt (typical desk angle). You’ll need a protractor (to mark angles), a colorimeter (like the X-Rite i1Display Pro, $299), and test patterns—specifically 25%, 50%, and 100% saturated red, green, blue, and gray swatches (these colors reveal distortion most clearly).
Start at 0° (direct view): record baseline values with the colorimeter: average brightness (e.g., 350 nits for a 1080p IPS), contrast ratio (1000:1 to 1440:1), and ΔE (color deviation from standard, ideally <2). Now, slowly move left/right/up/down, stopping at 10°, 20°, ..., 170°, 175°, 178°—mark each position with the protractor. At each stop, re-run the colorimeter: note brightness drop (e.g., “At 170°, brightness fell to 280 nits—a 20% loss”), ΔE shifts (e.g., “Green swatch at 175° hit ΔE=4.2”), and color temperature changes (e.g., “Gray background at 178° shifted from 6500K to 7200K, feeling warmer”).
Most users sit 2–3 feet from a 24–27” screen, so the maximum off-center angle they’ll naturally experience is ~30–45° (since tan(30°) ≈ 0.57, meaning your eye is 0.57x the screen height away horizontally). But professionals (designers, programmers) often share screens with 5+ people, so testing up to 178° matters. For example, a budget IPS might hit ΔE=7 at 175° (barely noticeable to casual viewers) but jump to ΔE=12 at 178° (obvious color shift). A mid-range panel (e.g., Dell S2721QS) keeps ΔE <5 at 175° and <7 at 178°—usable for most.
Contrast ratio degradation is another hidden metric: at 170°, a top-tier IPS (LG 27GP950) retains 85% of its center contrast (1440:1 → 1224:1), while a cheaper model (AOC 27G2U) drops to 60% (1000:1 → 600:1). That 25% difference means darker scenes (like movies or spreadsheets) look washed out faster on lower-end panels.
To summarize, here’s what to track at each angle:
|
Angle (°) |
Key Metrics to Record |
Ideal Target |
|---|---|---|
|
0 |
Brightness (nits), ΔE, Contrast Ratio |
300–400 nits, ΔE <2, 1000:1–1440:1 |
|
170 |
Brightness loss (%), ΔE shift |
≤25% loss, ΔE ≤5 |
|
175 |
Color temperature shift (K), Gray uniformity |
≤7000K, ΔE ≤7 |
|
178 |
Visible distortion (yes/no), Edge brightness |
No color cast, ≥50% center brightness |
If your panel fails at 175° (e.g., red turns pink, ΔE=8), it’s not a true “wide-view” IPS—save your cash for models with hard-coating polarizers (like ASUS ProArt PA278CV) that reduce angle-related distortion by 30% compared to basic IPS panels.
Inspecting Color Uniformity
First, set up your workspace: dim ambient light to 50 lux (dimmer than a nightlight) to eliminate external color interference, and place the panel 24 inches (61cm) away—standard viewing distance for 24–27” screens. You’ll need a X-Rite i1Pro 3 spectrophotometer ($1,499) for accurate color measurements, plus test patterns: specifically, a 3x3 grid of 25%, 50%, and 100% saturated patches (red, green, blue, cyan, magenta, yellow, gray) covering the screen.
Start with the center patch (position [2,2] in the 3x3 grid): measure its brightness (nits) and chromaticity coordinates (x,y) using the spectrophotometer. Let’s say a mid-range IPS (Dell U2723QE) hits 380 nits at 6500K (x=0.313, y=0.329)—this is your baseline. Now move to the four edge patches ([1,2], [2,1], [2,3], [3,2]) and finally the four corner patches ([1,1], [1,3], [3,1], [3,3]). For each, record brightness (nits) and ΔE (color deviation from the center).
Light spreads from the edges, so corners often get less light—they can be 15–30% dimmer than the center. For example, a budget IPS (AOC 27G2U) might have a center brightness of 320 nits but drop to 220 nits (31% loss) at the top-right corner. A premium panel (LG 27GP950) with full-array local dimming (FALD) limits this to 8–12% loss (350 nits center → 310 nits corner).
The human eye notices ΔE >3 as a “visible difference,” so aim for ΔE ≤3 across all patches. Let’s test the 50% gray patch: the Dell U2723QE has a center ΔE=1.2, edges ΔE=2.1, corners ΔE=2.8—all under 3, so it looks uniform. Center ΔE=1.5, edges ΔE=4.3 (pinkish tint), corners ΔE=5.1 (yellowish cast)—glaringly uneven.
A panel might be 6500K (neutral white) at the center but drift to 6800K (warm) at the edges. For the Dell, edge temperature stays within 6500K ±50K; the AOC jumps to 6800K ±100K, which feels “off” even if ΔE is low.
To pass a basic uniformity check, aim for <25% brightness loss at the corners and ΔE ≤3 across all patches. For professional use (photography, video editing), tighten it to <15% brightness loss and ΔE ≤2.
Pro tip: Use software like CalMAN ($99) to automate measurements—sync it with your spectrophotometer, and it’ll generate a uniformity heatmap showing exactly where deviations occur.
Testing for Backlight Bleed
Start with the right setup: turn off all ambient light (0 lux), set the panel to 100% brightness (max backlight output), and display a pure black test image (RGB 0,0,0) with a thin white border (10% brightness) along all four edges—this highlights uneven light leakage. Use a calibrated brightness meter (like the Klein K-10A, $249) to measure two key spots: the center of the screen (where brightness should peak) and the corners/edges (where bleed typically occurs).
Let’s take a 27-inch IPS panel as an example. A budget model (AOC 27G2U) with edge-lit backlighting might show: center brightness = 400 nits (as expected at 100% brightness), but the top-left corner hits 80 nits—20% of the center’s brightness. That’s visible bleed: if you’re watching a movie with a dark room, the corner glows like a tiny nightlight. A mid-range panel (Dell S2721QS) with better edge-lit design cuts this to 8–12% of center brightness (32–48 nits). Premium models with full-array local dimming (FALD), like the LG 27GP950, restrict bleed to 3–5% (12–20 nits)—barely noticeable even in pitch-black rooms.
Measure the bleed area (in square inches/cm²) where brightness exceeds 10% of the center. For the AOC, that’s ~1.5 in² (9.7 cm²) along both top edges; the Dell has ~0.8 in² (5.2 cm²); the LG? Just 0.3 in² (1.9 cm²). The larger the bleed area, the more distracting it becomes—especially on 27”+ screens where edges are farther from your direct line of sight.
Use a colorimeter to check: the AOC’s bleed area might hit ΔE=3.5 (yellowish), while the Dell stays at ΔE=1.8 (near-neutral), and the LG at ΔE=1.2 (invisible). The human eye notices ΔE >2 as “off,” so aim for ΔE ≤2 in bleed zones to keep blacks looking pure.
This tech adds cost (FALD panels run ~300 pricier than edge-lit) but slashes bleed by 60–70% in real-world tests.
Here’s how bleed performance breaks down across common panel types:
-
Budget (Edge-Lit): Max bleed brightness hits 60–100 nits (15–25% of center), bleed area spans 1.2–2.0 in² (7.7–12.9 cm²), and bleed zones show ΔE=3.0–4.5 (very noticeable, 4–5/5 scale).
-
Mid-Range: Max bleed brightness drops to 30–50 nits (8–12% of center), bleed area shrinks to 0.5–1.0 in² (3.2–6.5 cm²), with ΔE=1.5–2.5 (moderate, 2–3/5 scale).
-
Premium (FALD): Max bleed brightness stays ultra-low at 10–20 nits (3–5% of center), bleed area is tiny at 0.1–0.5 in² (0.6–3.2 cm²), and ΔE=1.0–1.8 (barely noticeable, 1/5 scale).
To pass a “no bleed” test for daily use, aim for ≤15% center brightness and ΔE ≤2 in bleed zones. For professional work (editing photos/videos), tighten it to ≤10% brightness and ΔE ≤1.5.
Pro tip: Take photos of the black screen with your phone (set to manual mode, ISO 100, shutter speed 1/15s) to document bleed.
Identifying Dead Pixels
For a 27-inch 4K IPS panel (pixel density ~218 PPI), the best testing environment is a dark room (0 lux ambient light)—any external light will mask subtle dead pixels.
For a new IPS panel, manufacturers typically allow up to 3 dead pixels under warranty (varies by brand: LG allows 5, Samsung 3). But “allowable” doesn’t mean “unnoticeable.” A single dead white pixel on a black background is visible from 12–18 inches away (standard viewing distance for 24–27” screens)—about the length of your arm. At 24 inches, a 1-pixel white dot covers ~0.0003% of the screen but has a contrast ratio of 1,000,000:1 against black, making it pop like a tiny star.
A 24-inch 1080P panel (PPI ~92) packs pixels more loosely than a 27-inch 4K panel (PPI ~218). In the 1080P panel, a dead pixel spans ~0.003 in² (1.9 cm²)—large enough to see from 2 feet away. In the 4K panel, the same dead pixel shrinks to ~0.0007 in² (0.45 cm²)—barely visible unless you’re 6 inches from the screen.
Testing steps: Start with full black (0,0,0 RGB) to catch dead white and fixed-color pixels. Next, use full white (255,255,255 RGB) to find dead black pixels—these look like small black holes in the bright field.
Data from display labs shows that new IPS panels have an average dead pixel rate of 0.3–0.7 per million pixels. For a 27-inch 4K panel (14,745,600 total pixels), that translates to 4–10 dead pixels—but most are clustered in corners or edges, where they’re harder to spot. Cheaper panels (e.g., AOC 27G2U) can hit 1–2 dead pixels per million (15–30 total), while premium models (LG 27GP950) often stay below 0.2 per million (3–4 total).
A 32-inch 4K IPS panel (PPI ~138) has larger pixels than a 27-inch 4K (PPI ~218), so dead pixels are 2–3x more visible even at the same count. Increasing brightness to 100% (vs. 50%) makes dead white pixels 40% more noticeable due to higher contrast with the surrounding pixels.
Here’s a quick reference for what’s “acceptable” vs. “problematic”:
-
0 dead pixels: Perfect—no distractions.
-
1–3 dead pixels: Barely noticeable for daily use (movies, browsing).
-
4–6 dead pixels: Noticeable during close-up work (photo editing, gaming).
-
7+ dead pixels: Highly distracting—even a single dead white pixel in a dark scene ruins immersion.
Pro tip: For permanent dead pixels, contact the manufacturer: most brands replace panels with >5 dead pixels under warranty.
Read more

An IPS panel offers 178-degree wide viewing angles, reducing color distortion significantly compared to TN panels (often under 160 degrees), and provides Delta E < 2 color accuracy, ensuring viv...

TFT (Thin-Film Transistor) displays, a foundational LCD technology, often show limited 160° viewing angles with noticeable color shifts, while IPS (In-Plane Switching), a refined TFT variant, deliv...


Leave a comment
This site is protected by hCaptcha and the hCaptcha Privacy Policy and Terms of Service apply.