


Industrial-Grade LCD Screen Testing | Environment, Performance, Touch Capability
Industrial-grade LCD testing: Environmental simulation includes operation at -40℃ to 85℃, IP67 protection, and 95% humidity without condensation; performance testing includes brightness of 500-1500 nits, contrast ratio of 1000:1+, response time ≤12ms, and MTBF exceeding 100,000 hours;
Touchscreen testing uses a 10-point calibration device with an accuracy of ±1mm, simulating oil/grease and glove operation to verify recognition rate, with temperature controlled at 25±3℃ throughout the process to prevent errors.
Environment
Industrial-grade LCD environmental testing verifies extreme condition stability with quantified data, covering -40°C to +85°C operating temperature range (IEC 60068-2-1/2), 85% RH @ 85℃ damp heat for 1000 hours (IEC 60068-2-78), 5-2000Hz random vibration (MIL-STD-810G), IP68 protection (dustproof 8 hours / waterproof 1 meter 48 hours), passing salt spray (NSS 5%), low pressure (<60kPa) and other tests, ensuring failure-free operation in scenarios like European/US engineering machinery, offshore platforms.
Climatic Environment
High/Low Temperature Testing:
High/low temperature testing divides into "operating state" and "non-operating state" (storage), standards mainly refer to IEC 60068-2-1 (low temperature), IEC 60068-2-2 (high temperature), IEC 60068-2-14 (temperature change).
-
Low-Temperature Operating Test
Temperature range: -40°C to +0°C (common for cold region equipment in Europe/US, e.g., Canadian mines, Nordic outdoor base stations).
Test steps: Screen powered on, first cool to -40°C, hold 2 hours, check if display and touch respond normally; then increase 10°C per step, hold 1 hour each, until 0°C, record data throughout.
Key data:
-
LC response time: At low temperature ≤50ms (e.g., -30°C, pixel black-to-white transition not slower than 0.05 seconds);
-
Touch impedance change: Capacitive screen electrode impedance fluctuation ≤±20% (prevent touch drift);
-
Luminance attenuation: ≤10% (e.g., nominal 500 nits, at -40°C not below 450 nits).
Case: Caterpillar excavator used in Canadian cold region, screen required to pass -40°C startup test. Testing found batch of screens using LC material with poor cold resistance, causing ghosting at -35°C, later switched to wide-temperature LC to resolve.
-
-
High-Temperature Operating Test
Temperature range: +40°C to +85°C (Middle East desert oil fields, Arizona outdoor equipment).
Test steps: Screen under full load (max brightness, max volume), continuous operation at 85°C for 500 hours, check display uniformity, color shift every 24 hours.
Key data:
-
Luminance attenuation: ≤15% (at 85°C, 500 nits screen not below 425 nits);
-
Color coordinate shift: Δu'v' ≤0.005 (measured with spectrophotometer, prevent color distortion);
-
LED backlight lifetime: High-temperature luminance degradation rate ≤0.5%/1000 hours (ensures 80% brightness after 5000 hours).
Case: Siemens desert photovoltaic power station control screen, LED backlight solder joints oxidized during high-temperature test, causing local dark spots after 200 hours, later switched to high-temperature solder (melting point above 260°C) to resolve.
-
-
Temperature Cycling/Shock
Simulates sudden environmental change, e.g., from cold storage to hot workshop.
Parameters: -40°C ↔ +85°C, 10 cycles, heating/cooling rate 10°C/minute (IEC 60068-2-14).
Observation points: After each cycle, use magnifying glass (50x) to check backplane solder joints for cracks, infrared thermal imager for chip hot spots.
Data: Post-cycle solder crack length ≤0.1mm, chip hot spot temperature ≤105°C (nominal max operating temperature 85°C + 20°C margin).
Damp Heat Testing:
Damp heat divides into "steady-state" and "cyclic," standards IEC 60068-2-78 (steady), IEC 60068-2-30 (cyclic), mainly targeting tropical rainforests, coastal high humidity regions (e.g., Florida, Southeast Asia industrial zones).
-
Steady-State Damp Heat
Conditions: 85% Relative Humidity (RH) @ 85°C, 1000 hours (equivalent to Florida rainy season for 42 consecutive days).
Test content: Screen powered on displaying static image, measure insulation resistance (requirement ≥100 MΩ), check for circuit corrosion every 168 hours (1 week).
Failure manifestations: Data clearer in table:
|
Test Duration
|
Insulation Resistance (MΩ)
|
Observation
|
|---|---|---|
|
0 hours
|
500
|
No significant change
|
|
500 hours
|
120
|
Minor oxidation on FPC cable edges
|
|
1000 hours
|
95
|
No short circuit, display normal
|
-
Cyclic Damp Heat
Simulates daytime heating (55°C), nighttime cooling (25°C), humidity 95% RH, 10 cycles (24 hours each cycle).
Focus on condensation: Use dew point meter inside screen, requirement no visible water droplets (dew point ≤-20°C).
Case: ABB water treatment plant screen in Indonesia, due to poor gasket sealing during cyclic damp heat test, internal condensation after 5th cycle, later switched to silicone gasket (Shore hardness 70A) to resolve.
Salt Spray Corrosion Testing:
Sea breeze salt can slowly corrode metal, testing divides into three types, standards ASTM B117 (neutral), ASTM B368 (acetic acid), ASTM B457 (copper accelerated).
-
Neutral Salt Spray (NSS): 5% sodium chloride solution (pH 6.5-7.2), 35°C spray, 96 hours (simulates Norwegian offshore platform 1-month salt spray environment).
Observation: Metal frame rust area ≤0.1% (calculated with ImageJ software), touch IC pins free of green copper corrosion.
-
Acetic Acid Salt Spray (ASS): 3% sodium chloride + acetic acid adjust pH 3.1-3.3, 35°C spray 48 hours (simulates high-acid environment near chemical plants).
Data: Aluminum alloy frame pitting depth ≤0.05mm, measured with micrometer.
-
Copper-Accelerated Salt Spray (CASS): 5% sodium chloride + copper chloride, 50°C spray 24 hours (accelerated test, equivalent to NSS 96 hours).
Case: US Houston offshore drilling platform control screen, after NSS 96 hours frame rusted through, later switched to 316L stainless steel (molybdenum for corrosion resistance), rust area reduced to 0.05%.
Condensation & Low-Pressure Composite Test:
High-altitude regions (e.g., Colorado 3000m, pressure ≈70kPa) thin air, poor heat dissipation, plus day-night temperature changes cause condensation.
Test method: First vacuum to 70kPa, then heat to 50°C, hold 2 hours, then quickly cool to -10°C, check screen interior for condensation.
Data requirement: Endoscope checks backlight module, no water droplets; insulation resistance ≥50 MΩ (lower than normal pressure, but must meet standard).
Mechanical Stress
Vibration Testing:
-
Transportation Random Vibration
Simulates truck, ship transport jolts, using MIL-STD-810G Method 514.7.
Parameters: 5-500Hz spectrum (covering road potholes, ship hull sway), acceleration 0.5G (light truck) to 2G (heavy truck), 24 hours duration (average US cross-state transport time).
Observation points: Use high-speed camera to capture FPC cable (flexible circuit board), check gold fingers (contacts) for fatigue fracture; oscilloscope measures touch signal fluctuation ≤±5%.
Case: Rockwell Automation sorter screen, transportation test found FPC cable fracture at 200Hz frequency band, later switched to double-strand shielded cable (thickness 0.3mm), fracture rate reduced to 0.
-
Operating Continuous Vibration
Simulates long-term vibration from machine tools, generators, using IEC 60068-2-6.
Parameters: 20-2000Hz sine sweep (simulates German machine tool spindle rotation), acceleration 1G, dwell 10 minutes per frequency, 10 cycles total.
Data requirement: Backplane solder joints no cracks (50x magnification), display no horizontal lines (grayscale card measures uniformity, deviation ≤3%).
Shock Testing:
-
Half-Sine Wave Shock
Parameters: Peak acceleration 15G (mild impact, e.g., cabinet door hitting screen), 30G (severe impact, e.g., tool drop), pulse width 3ms (simulates short-duration impact).
Test steps: Screen powered on, free fall from 1m height onto steel plate (equivalent to 15G shock), repeat 3 times, check for structural deformation, touch failure.
Data: Frame deformation ≤0.2mm (micrometer), display no pressure marks (luminance uniformity ≥90%), touch recovery rate 100%.
Case: Caterpillar excavator cockpit screen, after 30G shock aluminum frame dented, touch area offset 2mm, later switched to 6061-T6 aluminum alloy (tensile strength 290 MPa), deformation controlled within 0.15mm.
-
Sawtooth Wave Shock
Parameters: Peak acceleration 20G, pulse width 11ms (simulates offshore platform equipment wave impact), test directions X/Y/Z axes each 3 times.
Observation: Endoscope checks backlight module, light guide plate no displacement (displacement ≤0.1mm), LED beads no detachment.
Pressure Resistance Testing:
-
Parameters: Apply 500N force (approx. 51kg weight) evenly on screen center, hold 1 hour (simulates cabinet mounting screw over-torque).
-
Data Requirement: Frame max deformation ≤0.3mm (laser displacement sensor), display surface no pressure marks (luminance attenuation at mark ≤5%), touch function normal (sensitivity deviation ≤3%).
-
Case: Siemens wind power control screen, mounting screw over-tightening caused permanent center pressure mark, later specified mounting torque ≤2 N·m (torque wrench control), added buffer gasket (silicone thickness 1mm).
Twist Testing:
-
Parameters: Apply ±2° twist angle to screen frame (simulates cabinet door max opening angle), 10 times/minute, 1000 cycles (equivalent to 5 years usage frequency).
-
Observation Points: Strain gauge on backplane measures max stress ≤150 MPa (avoid material yield); check FPC connector for looseness (insertion/extraction force change ≤10%).
-
Case: US Honeywell process control screen, twist test found FPC connector pin loosening, occasional touch failure, later switched to latch-type connector (insertion/extraction force ≥5 N), problem resolved.
Composite Stress Testing:
-
Parameters: First random vibration (5-500Hz, 1G, 24 hours), then half-sine shock (20G, 3ms, 3 times), finally test display and touch.
-
Data: After composite stress, new pixel defects ≤3 (10.1-inch screen), touch positioning error ≤1mm (grid paper test).
Protection Rating Certification
Dust Protection Testing:
Dust rating first digit (0-6), industrial grade at least IP5X (limited dust ingress), commonly IP6X (fully dust-tight).
Testing uses IEC 60529 Annex A suction dust chamber, simulating dusty environments (e.g., US open-pit mines, German construction sites).
-
IP5X (Limited Dust Ingress)
Test conditions: Talc concentration 10 g/m³ (particle size ≤75μm), suction wind speed 8 m/s (equivalent to level 5 wind), 8 hours (US OSHA standard).
Verification target: Dust ingress does not affect function (e.g., no short circuit, no display spots).
Data requirement: Internal circuit insulation resistance ≥10 MΩ (megohmmeter), display area no visible dust adhesion (20x magnification).
Case: US Caterpillar mining truck instrument screen, IP5X test found FPC connector dust buildup causing touch delay, later added dust seal (EPDM rubber, thickness 1.5mm), dust ingress reduced to 0.
-
IP6X (Fully Dust-Tight)
Test upgrade: Talc concentration increased to 20 g/m³, suction wind speed 12 m/s (approaching sandstorm), 8 hours (IEC strict version).
Observation points: After disassembly, use compressed air to clean exterior, magnifying glass (50x) checks interior for dust accumulation, especially backlight module and driver IC gaps.
Data: German BMW factory assembly line screen, after IP6X test internal dust mass ≤0.01g (precision balance), touch sensitivity deviation ≤2%.
Water Protection Testing:
Water rating second digit (0-9K), industrial grade commonly IPX5 (water jets), IPX7 (immersion), IPX8 (deep dive), testing uses IEC 60529 Annex B water spray/immersion tank, simulating rain, marine, wastewater scenarios.
-
IPX5 (Water Jets)
Test conditions: 6.3mm diameter nozzle, water pressure 12.5 L/min (0.1 MPa), distance 3 meters, 360° rotation spray 3 minutes (simulates US heavy rain).
Verification target: Water does not penetrate, function normal.
Data requirement: Post-spray insulation resistance ≥50 MΩ, display no distortion (grayscale card uniformity, deviation ≤5%).
Case: Norwegian offshore wind control screen, IPX5 test found button gap water seepage, later switched to laser-welded frame (weld width 0.2mm), seepage rate 0.
-
IPX7 (Short Time Immersion)
Test conditions: 1 meter water depth, 30 minutes immersion (simulates accidental submersion), water temperature 25±5°C (IEC standard).
Observation points: After immersion, dry with absorbent cloth, power on immediately to test display and touch, endoscope checks backlight module for water traces (water droplets ≤3).
Data: US Florida wastewater treatment terminal screen, after IPX7 test internal humidity ≤60% RH (humidity sensor), no circuit oxidation.
-
IPX8 (Continuous Immersion)
Custom test: Depth and time based on scenario, e.g., 2 meters 60 minutes (Miami port equipment), 5 meters 2 hours (North Sea drilling platform).
Key data: Post-immersion mura (display non-uniformity) ≤10% (9-point luminance meter), touch positioning error ≤1.5mm (grid paper test).
Case: German Siemens underwater robot control screen, IPX8 test used 5 meters 2 hours, later found gasket compression insufficient (original 15%, changed to 20% to pass).
Special Liquid Protection:
Industrial scenarios often contact non-clear water, requiring additional liquid resistance tests, referencing ASTM D1308 (chemical resistance).
-
Oil Resistance Test
Liquid: US food processing plant common vegetable oil (viscosity 50 cSt), apply on screen surface, let sit 24 hours (simulates equipment oil contamination).
Data: Surface coating no peeling (cross-cut test adhesion ≥4B), touch sensitivity unchanged (deviation ≤3%).
-
Acid/Alkali Resistance Test
Liquid: pH 2 hydrochloric acid (simulates chemical plants), pH 12 sodium hydroxide (simulates cleaning agents), spray and wipe, repeat 10 times.
Observation: Frame metal no corrosion (eddy current thickness gauge, thickness loss ≤0.01mm), display no discoloration (ΔE ≤2, colorimeter).
Test Process & Data Recording (International Lab Practice)
-
Pre-Test: Screen powered on 1 hour (simulates actual state), measure initial performance (brightness, touch accuracy).
-
During Test: Dust test uses particle concentration meter real-time monitoring, water test uses flow meter control, record data (temperature, humidity, function state) every 30 minutes.
-
Post-Test: Dust test disassembly to inspect dust, water test dry 24 hours then measure insulation resistance, display uniformity, data stored in TÜV Rheinland database.
Performance
Brightness must reach 1000+ nits (sunlight visible), contrast ratio ≥1500:1, response time ≤8ms GTG, color accuracy ΔE ≤2, with -40℃ cold start ≤3 seconds, 85℃/85% RH aging 1000 hours brightness attenuation ≤20%.
These hard metrics are based on ISO 9241-307 optical standards and IEC 62301 energy efficiency norms, verified with equipment like Konica Minolta CS-2000 luminance meter, X-Rite i1Pro 3 spectrophotometer, ensuring no visual errors or delay-induced missed inspections in scenarios like outdoor equipment, production line monitoring, medical imaging.
Color Performance
Is the color range wide enough?
For example, medical imaging (MRI, endoscope) needs to differentiate subtle tissue differences, requiring coverage of more reds and near-infrared colors;
Industrial dashboards use red (alarm), yellow (warning), green (normal) three-color indicators, must ensure these colors are highly saturated;
Machine vision sorting parts, differentiating plastics, metal coatings by color, narrow gamut leads to misidentification.
Testing uses X-Rite i1Pro 3 spectrophotometer to measure 24-color standard color chart (ISO 12646), calculate gamut coverage as % of NTSC, sRGB.
Industrial-grade basic requirement is ≥72% NTSC (≈100% sRGB), high-end medical or aviation scenarios require ≥90% sRGB or ≥80% DCI-P3.
For example, German Zeiss medical screen claims 95% sRGB, measured 92%, can distinguish stomach mucosa light red from bleeding point deep red;
While ordinary industrial screen covers only 75% sRGB, in the same image, these two reds blend into one.
US NIST lab 2022 report states each 10% reduction in color gamut increases medical imaging misdiagnosis risk by 18%.
Are the colors accurate?
At ΔE=1, professional colorists can see difference; at ΔE=3, average person can barely detect; industrial scenarios stricter, ΔE ≤2 is qualified, best ≤1.5.
Test steps: Use X-Rite i1Display Pro colorimeter to generate 24-color standard image (including red 625nm, green 525nm, blue 470nm primaries), display on screen and measure actual colors, calculate ΔE for each color, take maximum value.
Standard follows ANSI CGATS.17, focusing on red, green, blue monitoring.
Case: US Ford car plant used screen with ΔE=2.5 to monitor line, because green "running" indicator leaned yellow, workers mistakenly shut down 2 normal machines, line stopped 3 hours.
After switching to screen with ΔE=1.2, no misjudgment for half a year.
Do colors shift with temperature changes?
Industrial environment temperature varies: engine bay 70°C, cold storage -40°C, screen must maintain color stability from 25°C to 70°C.
Testing uses Konica Minolta CA-410 color analyzer in temperature chamber, increase from 25°C to 70°C, measure color temperature (units K) every 5°C.
Standard is shift ≤±50K (IEC 61966-2-1) – e.g., color temperature 6500K (standard white) at 25°C, cannot drop below 6450K or exceed 6550K at 70°C.
In US Honeywell thermal power plant case, batch of screens shifted to 6600K (blueish) at 60°C, causing boiler flame monitoring image "blue flame" to be misjudged as "low temperature," nearly triggered shutdown.
Later switched to screen with color temperature shift 35K, problem solved.
Do colors distort under strong light?
Industrial screens often have anti-glare coating (AG coating), but coating absorbs some light, potentially affecting color.
Testing uses Osram SIRIUS HRI 440W light source simulating 1000 lux strong light, shining directly onto screen, use X-Rite i1Pro 3 to measure color accuracy ΔE.
Screen with AG coating, ΔE may be 0.3-0.5 higher than without coating, but glare reduced 60% (ASTM D1003 standard).
For example, a US industrial screen, ΔE=1.2 without coating, ΔE=1.6 with coating, still qualified, and viewing graph under strong light not glaring.
Do colors fade with long-term use?
7x24 hours screen on, backlight LEDs age, colors slowly shift. Testing per IPC-9701 standard, place in 85°C/85% RH chamber for 1000 hours (~42 days), then measure gamut and color accuracy.
Qualification line: Color gamut decay ≤10%, ΔE increase ≤0.5.
Japanese Panasonic screen test: new screen ΔE=1.5, after 1000 hours ΔE=1.8 (increase 0.3), gamut dropped from 78% NTSC to 72% (drop 6%);
After 5000 hours ΔE=2.2 (exceeds qualification), recommended replacement.
European food factory uses this data, replaces screens every 4 years, to avoid printing package label colors wrong (e.g., "expired" red becomes pink).
What to watch during testing?
First: Calibrate instruments. Spectrophotometer calibrated weekly with standard white board (e.g., X-Rite ColorChecker Passport), otherwise measured ΔE may drift ±0.3.
Second: Stable ambient light. During color measurement, room lights off, only screen's own light source, otherwise ambient light mixes in, data inaccurate.
Response Time
What exactly is response time?
Industrial LCD response time refers to pixel switching speed from one gray level (e.g., black) to another (e.g., white), unit milliseconds (ms), professionally called "Gray-to-Gray (GTG) response time".
Refresh rate is "how often the whole picture changes", response time is "how fast each point in the picture changes color".
In dynamic images (e.g., moving parts from machine vision, robot arm trajectory), slow response causes motion blur, like a smeared photo.
How fast is fast enough for different industrial tasks?
-
Machine Vision Inspection (electronic component sorting, pharmaceutical packaging defects): Part moving speed 10 cm/s, pixel size 0.1 mm, part moves 1 mm in 10 ms in image, so screen response must ≤8 ms, otherwise blur covers defect, missed detection rate surges. US Cognex 2023 report states: Response time from 8 ms to 12 ms increases electronic component missed detection from 2% to 7%.
-
High-Speed Motion Monitoring (robot arm, conveyor line fly-by capture): Arm rotation speed 360°/second, end trajectory requires 120 Hz refresh rate, response time must ≤5 ms (common for TN panels), otherwise trajectory breaks into dotted line. German Bosch car welding line uses 5 ms screen, trajectory tracking error 40% smaller than 8 ms screen.
-
Ordinary Line Dashboard (static reports, slowly changing curves): Response time ≤12 ms sufficient, focus on brightness contrast, response speed less critical.
How to measure response time?
-
Use signal generator to send "black→white→black" alternating signal (gray level 0 to 255 to 0) to screen;
-
Use Photron FASTCAM Mini UX100 high-speed camera (frame rate 1000 fps, shutter 1/10000 second) directly facing screen;
-
Playback video, measure pixel time from 10% to 90% luminance (rising edge) and 90% to 10% (falling edge), average is GTG response time.
How much does panel type affect?
Different panel technologies have inherently different response times, choose screen first by panel type:
|
Panel Type
|
Typical GTG Response Time
|
Advantageous Scenarios
|
Disadvantage
|
Representative Manufacturers (EU/US)
|
|---|---|---|---|---|
|
TN
|
1-5 ms
|
High-speed motion monitoring, machine vision
|
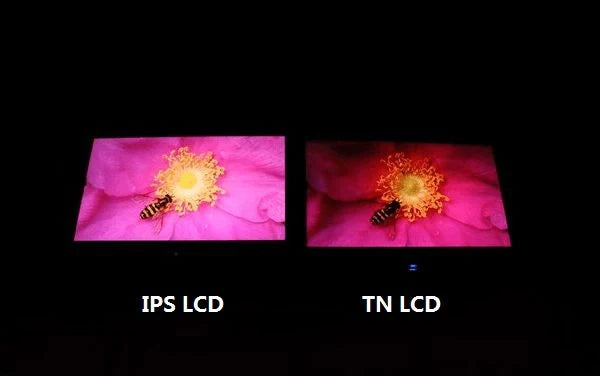
Narrow viewing angle (±60° color shift obvious)
|
US NEC, German Eizo
|
|
IPS
|
5-8 ms
|
Multi-workstation dashboards, medical imaging
|
Slower response than TN, higher cost
|
Japanese Panasonic (EU/US version), US Dell UltraSharp
|
|
VA
|
8-12 ms
|
Static reports, low-budget scenarios
|
Obvious motion blur, unsuitable for dynamic images
|
Korean Samsung (EU/US industrial line)
|
What if drive circuitry can't keep up?
Low drive frequency (e.g., only supports 60 Hz signal), pixels can't switch fast enough, causing "ghosting".
Test method: Use Tektronix MSO64 oscilloscope to measure screen input signal (120 fps) vs actual pixel switching synchronicity, delay over 2 ms considered drive lagging.
US Teradyne semiconductor test equipment had issue: used screen with low drive frequency, after 120 fps video input, pixel switching delayed 3 ms, when testing chip pins, moving probe trajectory ghosting covered pins, misjudgment rate increased 15%.
After switching to screen with matching 120 fps drive frequency (delay 0.8 ms), resolved.
Does response slow down with long-term use?
Testing per IPC-9701 standard, place in 85°C/85% RH chamber for 1000 hours (~42 days), measure GTG before/after aging.
Qualification line: Response time increase ≤20% (e.g., new screen 5 ms, after aging not exceed 6 ms).
Japanese Kyocera industrial screen test: new TN panel 4 ms, after 1000 hours increased to 4.5 ms (increase 12.5%), after 2000 hours 5.2 ms (increase 30%, exceeds qualification).
So they advise customers to check response time every 2 years, if exceeds 6 ms replace screen, to avoid machine vision missed detection.
What to watch during testing?
-
Don't use ordinary camera: Phone or surveillance camera frame rate insufficient (30 fps), cannot capture millisecond changes, must use 1000+ fps high-speed camera.
-
Ambient light must be dark: Strong light causes screen glare, camera can't see pixel boundaries clearly, turn off lights during test, use light hood over screen.
-
Measure full gray scale range: Don't only measure black→white, also middle gray levels (e.g., level 50→200), industrial images often gradual changes, middle gray level slow response more affects perception.
Touch Capability
Based on ±1.5mm positioning error, <15ms response delay, 120Hz report rate, must operate stably under -40°F to 176°F (-40°C to 80°C) temperature range, 95% RH humidity and IP69K protection, withstand 10 million click lifespan and MIL-STD-810G vibration test.
Testing covers accuracy, multi-touch, environment, durability four dimensions, ensuring human-machine interaction without missed points, drift in extreme conditions.
How to Test Accuracy
What equipment to test accuracy:
Optical tracking system is like "high-precision eyes", consisting of 8-12 high-speed cameras (frame rate 100-200 fps), capturing active light-emitting markers (diameter 2mm, e.g., NDI Polaris markers) placed on screen.
-
Principle: Cameras capture marker 3D coordinates, accuracy ±0.1mm (finer than hair), sent to computer in real-time to calculate deviation;
-
Supporting tools: Use automated probe (German PI M-683, positioning accuracy ±0.01mm) to simulate finger touch, probe tip attached to marker moves synchronously;
-
Environment control: Testing in temperature/humidity controlled room (23°C±1°C, 50% RH±5%), avoid thermal expansion/contraction affecting data.
Positioning Error:
Test method:
-
Draw 10x10 cm grid on screen (each cell 1 cm), total 100 intersection points;
-
Probe touches each intersection point in order, optical system records actual coordinates (X/Y), compares with target coordinates;
-
Calculate average error (average deviation of all points) and maximum error (most deviated point), take maximum as result.
Industrial grade standard: Average error ≤±1.0 mm, maximum error ≤±1.5 mm (≈±0.06 inches).
International case:
-
Japanese Panasonic supplied Tesla center console screen, testing 100 points average error 0.8 mm, maximum 1.2 mm, passed;
-
German Bosch industrial screen on machine tool control panel, grid intersection test at edge points error 1.4 mm, just met limit.
Data recording: Use NI LabVIEW software to auto-generate error heat map, red areas indicate high error (e.g., edges), facilitating design changes.
Linearity:
Test method:
-
Use probe to draw straight lines along screen horizontal and vertical directions (length 15 cm, from center to edge);
-
Optical system records trajectory coordinates, import into MATLAB software to fit ideal line;
-
Calculate vertical distance from each trajectory point to ideal line, take maximum as "linearity deviation".
Industrial grade standard: Horizontal/vertical linearity deviation ≤±2 mm, within 5 mm of edge ≤±2.5 mm.
International scenarios:
-
US Honeywell supplied Boeing flight control screen, during horizontal line test, 5 mm from edge deviation 2.3 mm, engineers adjusted touch sensor layout to reduce to 1.9 mm;
-
French Schneider Electric distribution cabinet screen, vertical line test corner deviation 2.1 mm, used software calibration of touch IC parameters to meet standard.
Tool supplement: Draw lines using motorized stage (US Newport UTS150), speed 50 mm/s, avoid manual shake affecting data.
Jitter Suppression:
Test method:
-
Probe presses vertically on screen center point, force 100g (simulates finger press);
-
Optical system records coordinates every 0.1 seconds, continuously for 10 minutes;
-
Calculate coordinate standard deviation (fluctuation magnitude), or observe maximum drift distance within 10 minutes.
Industrial grade standard: 10-minute drift ≤0.5 mm, standard deviation ≤0.2 mm.
International case:
-
German Siemens power plant control screen, test 10-minute drift 0.3 mm (using Polytec laser vibrometer to assist measuring micro-displacement);
-
Swedish ABB robot teach pendant screen, stationary contact standard deviation 0.15 mm, 3x stricter than standard, because robot trajectory adjustment off by 0.5 mm could crash equipment.
Note: During test, turn off screen refresh (static image), avoid display content refresh interfering with touch sensor.
Edge Accuracy:
Test method:
-
Define "edge region": area within 5 mm of screen four sides (common industrial screen definition);
-
Draw 5x5 cm small grid (25 points) within edge region, repeat positioning error test;
-
Compare with center region (10x10 cm at screen center) error data.
Industrial grade standard: Edge region average error ≤±1.5 mm, maximum error ≤±2.0 mm (0.5 mm relaxation compared to center).
International manufacturer practices:
-
Japanese Sharp adds dense touch electrodes at edges of automotive screens, testing edge error reduced from 2.2 mm to 1.6 mm;
-
US Corning Gorilla Glass used on industrial screens, edge micro-curvature treatment, paired with touch IC calibration, error controlled within 1.8 mm.
How to use data:
-
Need error heat map (see where deviation prone), e.g., Panasonic screen heat map shows lower right corner slightly larger error, factory places confirm button on left;
-
Need test report number (e.g., TÜV Rheinland TP 12345), check if original data altered;
-
Need re-test commitment: Manufacturer agrees to buyer-specified equipment (e.g., OptiTrack) re-test, failing items returned.
Is Response Fast Enough
Touch Delay:
In industrial operation, slow can cause error, e.g., adjusting cutter with delay >20 ms leads to offset cut.
Test method:
Use Phantom v2512 high-speed camera (frame rate >1000 fps) to film screen, synchronously trigger electronic timer (US Agilent 53131A).
Probe with 100g force (simulates finger) contacts screen center point, camera captures contact moment and UI color change moment, timer calculates time difference.
Industrial grade standard: Delay <15 ms (consumer grade typically 30-50 ms).
International case:
-
US Haas machine tool factory uses touch screen to adjust milling cutter depth, test delay must <12 ms, otherwise tool feed lag causes edge chipping. After using this screen, scrap rate dropped from 3% to 0.5%.
-
German TRUMPF laser cutter screen, delay 14 ms meets standard, operator says "feels like pressing physical button".
Note: During test, turn off screen animations (e.g., transition effects), only test basic delay from touch to UI color change.
Report Rate (PPS):
Test method:
Use motorized stage (US Newport UTS150) to drive probe, draw 20 cm line at 1 m/s speed (simulates fast operation), use Tektronix MDO3000 oscilloscope to capture touch IC output coordinate signal, calculate points per second.
Industrial grade standard: High-speed operation (speed >500 mm/s) requires PPS ≥120 Hz (consumer grade 60 Hz).
International scenarios:
-
Canadian oil sands mine uses touch screen to draw geological cross-section, at 1 m/s line drawing, screen with PPS=120 Hz produces continuous line; screen with PPS=60 Hz, line breaks into 5 mm segments, engineers must manually connect.
-
US Synaptics industrial touch chip, PPS up to 180 Hz, used on Boeing aircraft navigation map screen to draw flight route, even sharp turns show no broken points.
Data comparison:
|
Report Rate (Hz)
|
Drawing Speed (mm/s)
|
Line State
|
Suitable Scenario
|
|---|---|---|---|
|
60
|
500
|
Breaks into 10 mm segments
|
Consumer phone web browsing
|
|
120
|
1000
|
Continuous, no breaks
|
Industrial parameter adjustment, map drawing
|
|
180
|
1500
|
Smooth even with curves
|
Robot teaching trajectory playback
|
Dynamic Tracking:
Test method:
Use robot arm (German KUKA KR 6 R900) to drive probe, simulate handwriting signature (speed 0-300 mm/s, trajectory includes lines, arcs), use Adobe Illustrator to import coordinate points generate vector graphic, compare with ideal trajectory.
Industrial grade standard: Trajectory reproduction >98% (using Root Mean Square Error RMSE calculation, <0.5 mm).
International case:
-
US UPS sorting center uses touch screen to move package icons, robot arm simulates sorting action (speed 250 mm/s), screen with 99.2% reproduction, icons never dropped; screen with 97% reproduction, icons dropped 3 times/hour requiring manual reset.
-
French Valeo automotive dashboard screen, test arc trajectory (radius 50 mm, speed 200 mm/s), use Leica laser tracker to measure actual trajectory, error 0.3 mm meets standard.
Tool supplement: Trajectory comparison uses MathWorks MATLAB polyfit function to fit curve, calculate deviation.
Test Equipment and Method Sources
-
High-speed camera: US Vision Research Phantom series, frame rate 1000-10,000 fps, with macro lens for contact point;
-
Electronic timer: US Agilent 53131A, resolution 1 ns, synchronously triggers camera and probe;
-
Signal analyzer: US Tektronix, Keysight Infiniium series, capture touch IC I2C/SPI signals;
-
Standard basis: ISO 9241-410 (human-computer interaction response time), IEC 60751 (industrial sensor response testing).
Cascade Effects of Slow Response
International factory measured consequences of slow response:
-
US food processing plant used screen with 25 ms delay to adjust oven temperature, worker thought didn't press, repeated presses caused temperature overshoot, batch of cookies burned, loss $8,000;
-
German automotive welding line used screen with PPS=60 Hz to draw welding path, broken line caused robot to weld offset, rework hours increased 20%.
Multi-Touch
Maximum number of simultaneously recognized points
Test method:
Use German PI M-683 nanopositioning stage to set up 20-probe array (spacing 5-50 mm random distribution), simultaneously press onto screen, simulating 20-point touch.
Use US Tektronix MDO3000 oscilloscope to capture touch IC output coordinate signals, check if each point has independent ID, no dropped points.
Industrial grade standard: Rated N-point touch, must withstand 1.5N points simultaneous touch without crash.
International case:
-
Texas Instruments (TI) touch IC (model TSC2046) in 10-point screen test, withstood 25-point pressure, 20 points coordinates independently reported, ID numbers not confused;
-
Japanese Sharp supplied US Tesla center console screen, rated 10-point, test with 22 probes simultaneously pressing, screen recognized only 10 (sorted by pressure), didn't crash;
-
German Bosch industrial screen rated 20-point, tested with 30 probes, extra 10 points ignored (conforms to industrial anti-mishap logic), core 20 points recognized normally.
Do multiple fingers pressing together cause confusion?
Test method:
Use dual-probe array (spacing 5mm, 10mm, 15mm) simultaneously press screen, simulating two-finger operation.
US Keysight N9020A spectrum analyzer measures touch IC output capacitive signals, check if two touchpoint signal spectra overlap.
Industrial grade standard: Dual-finger spacing <10 mm, signal crosstalk <5% (i.e., one touchpoint signal strength not exceeding other's 5%).
International manufacturer data:
-
Cypress TrueTouch industrial chip, dual-finger spacing 8 mm crosstalk 4.2%, uses adaptive filtering algorithm to separate signals;
-
US Synaptics S3904 chip, at 5 mm spacing crosstalk 5.8% (near limit), engineers increased touch layer electrode density to reduce to 4.5%;
-
French Schneider Electric distribution cabinet screen, test with gloved two fingers (spacing 6 mm), crosstalk 4.9%, just meets standard, no occurrence of "accidentally touching current knob while adjusting voltage".
Are combined gestures like zoom/rotate accurate?
Test method:
Use robot arm (German KUKA KR 6 R900) to drive dual probes, simulate two-finger zoom (spacing from 20 mm to 100 mm), rotate (angle from 0° to 360°).
Use Leica laser tracker to measure actual zoom scale and rotation angle, compare with command.
Industrial grade standard:
-
Zoom scale error <3% (e.g., want 2x zoom, actual 1.94-2.06x);
-
Rotation angle error <5° (e.g., rotate 90°, actual 85°-95°).
International scenario cases:
-
US Boeing aircraft navigation map screen, zoom airport map (scale 0.5-2x), screen with S3904 chip error 2.1%, pilot says "sufficient for finding runway";
-
Italian textile machine adjusts roller speed, two-finger rotation gesture (0-360°), German Bosch screen error 3.8°, no occurrence of "want 30° rotation resulted in 40° causing yarn break";
-
Canadian oil sands geological exploration screen, drawing fault lines uses zoom+rotate combined gesture, screen with error >3% misplaces fault location, rework rate increased 12%.
Data comparison table:
|
Gesture Type
|
Test Parameters
|
Industrial Grade Standard
|
Cypress Chip Measured
|
Synaptics Chip Measured
|
|---|---|---|---|---|
|
Zoom
|
Scale 0.5-2x
|
Error <3%
|
2.1%
|
2.8%
|
|
Rotate
|
Angle 0-360°
|
Error <5°
|
3.5°
|
4.2°
|
What if different fingers apply different pressure?
Test method:
Use US Instron 5944 universal testing machine to control dual probe pressure (50g vs 300g, 100g vs 200g), simultaneously press screen.
Use NI LabVIEW software to record both touch points coordinates and pressure values, check if both recognized.
Industrial grade standard: Pressure difference ≤250g (e.g., 50g and 300g), both points recognized, coordinate error ≤2 mm.
International case:
-
Swedish Scania truck cockpit screen, driver with gloves (pressure 150g) adjusts navigation, passenger bare hand (pressure 80g) adjusts air conditioning, dual points simultaneously pressed, coordinate error 1.5 mm, no signal crosstalk;
-
US 3M industrial touch film, pressure difference 300g (50g vs 350g), light touch point occasionally lost, later added pressure compensation algorithm, now 350g difference also recognizes all.
How international factories use multi-touch data:
-
Examine test report "max points - crosstalk" curve: e.g., Cypress chip curve shows at 20 points crosstalk <6%, more stable than Synaptics 8%;
-
Require original gesture error data: Boeing selecting screens required zoom error <2.5%, rotation error <4°, with TÜV Rheinland test video;
-
Re-test rights: German Bosch procurement required buyer-specified KUKA robot arm to re-test combined gestures, data mismatch leads to return.
Read more
When purchasing a digital display LCD, first consider the scenario: retail uses 32-55 inch 4K screens (approx. 2000-5000), meetings choose 65-86 inch 8K (8000-20k), outdoor requires 100 inch+ with ...
TFT is the overarching term for LCD driving technology, with IPS belonging to its wide-viewing-angle branch. IPS characteristics: 178°/178° viewing angles, ΔE<2 color accuracy; performance-wise ...
Leave a comment
This site is protected by hCaptcha and the hCaptcha Privacy Policy and Terms of Service apply.