


How to Design a Custom LCD Display Module for Your Product | From Specification to Mass Production
From specification definition to mass production delivery, a custom LCD display module project typically runs 12 to 16 weeks. It covers 6 core stages: dimension confirmation, IC selection, FPC design, backlight matching, sample validation, and tooling development.
Over the past several years we have assisted more than 200 embedded projects in completing custom display solutions. Industrial applications account for roughly 40%, consumer electronics 35%, and medical and automotive each approximately 12% and 13%.
Our accumulated case documentation exceeds 40 files spanning the common 2.4-inch to 10.1-inch range. This article breaks down each stage into three major phases:
| Phase | Duration | Key Activities |
|---|---|---|
| Specification Definition | ~4 weeks | Size & resolution, brightness & viewing angle, interface & touch |
| Development | ~6 weeks | Glass & IC selection, FPC prototyping, backlight & cover glass |
| Mass Production Preparation | ~4 weeks | Sample validation, molds & jigs, incoming inspection & QC |
It covers selection criteria and common pitfalls at each stage.

Specification Definition
Size and Resolution
The first thing to figure out for a custom LCD is how much space you have. We encountered this in a handheld instrument project — the client reserved a display window of only 38.5 mm × 24.3 mm yet expected to display 8 full lines of text.
After measurement, we found that at this size a 128×64 pixel resolution could clearly render only 4 lines of 12 pt text. Compressing to 8 pt to show 8 lines pushed readability beyond the comfortable recognition distance of 30 cm[1].
The relationship between size and resolution comes down to pixel density (PPI) and viewing distance.
For common embedded screens between 3.5 and 7.0 inches, 320×240 (QVGA) through 1024×600 (WSVGA) represent the highest shipment density. Both driver ICs and glass substrates have mature supply chain support at these resolutions[2].
OLED and TFT show notable brightness and lifetime differences at the same size. Choose based on your application needs — see our TFT vs OLED Comparison for specifics.
We recommend fabricating a 1:1 acrylic mock-up first to confirm the visual impression before entering the formal drawing stage[3].
Resolution selection directly affects interface bandwidth and MCU processing capability. Here is how frame buffer size scales:
- A 320×240 16-bit color frame requires about 150 KB of frame buffer.
- An 800×480 24-bit color frame needs roughly 1.15 MB.
Both MCU RAM and SPI clock frequency must be scaled accordingly[4].
In one case, a client wanted to drive a 5-inch 800×480 TFT with an STM32F103. Maxing out the SPI bus at 36 MHz only yielded 6 fps.
Switching to an RGB parallel interface achieved 55 fps. A model like the 5-inch 800×480 TFT with native RGB support gives the designer more interface flexibility from the start.
Custom-shaped cutting is a growing trend in display customization. Round, chamfered, and notched screens are increasingly common in wearables and home appliance panels.
- Custom shapes add 5 to 10 days to lead time.
- Because of stress concentration at the glass edge, impact resistance typically drops by 15% to 30%[5].
If the product has drop reliability requirements, standard rectangular specifications are preferred. Custom shapes should include structural buffer layers.
Brightness and Viewing Angle
Brightness requirements depend on the final use environment. Here is a quick reference:
| Environment | Brightness Needed | Typical Products |
|---|---|---|
| Indoor | 250–400 cd/m² | Indoor equipment |
| Semi-outdoor | 500–800 cd/m² | Charging stations, POS terminals |
| Outdoor (high ambient light) | 1000+ cd/m² | Automotive infotainment, handheld terminals |
In one agricultural drone ground station project, the client originally selected a 350 cd/m² IPS TFT. Under midday sunlight the screen was nearly unreadable[6].
Replacing it with an 800 cd/m² high-brightness version plus an AR anti-reflective coating improved the contrast ratio from 3:1 to 12:1, passing final acceptance. This shows that brightness figures on datasheets must be verified under actual illumination.
A 3.5-inch IPS TFT is available in multiple brightness grades for side-by-side comparison.
Viewing angle selection is closely tied to the device's human-machine interaction pattern. The two main technologies compare as follows:
| Technology | Viewing Angle (H / V) | Best For |
|---|---|---|
| IPS | 170°+ / 170°+ | Multi-user or wide-angle operation |
| TN | 70° / 40° | Single-user front-view devices (advantages in response time and power)[7] |
Polarizer orientation also matters. Landscape devices use the 12-o-clock direction, and portrait devices use 6-o-clock.
Installing them reversed causes grayscale inversion during side viewing. We ran into this in a portable measurement instrument project where 200 pilot units showed negative display effects during side inspection.
Investigation confirmed that the polarizer mounting direction was inconsistent with the FPC-defined viewing direction[8].
We recommend specifying the viewing direction (12:00 / 6:00 / 3:00 / 9:00) when placing orders and confirming with a 45° angle photograph during the sample stage.
Brightness and viewing angle combinations are also constrained by the number of backlight LEDs and light guide plate design. At the same size:
- A 4-LED backlight and a 6-LED backlight can differ by over 30% in brightness.
- The extra LEDs add 0.2 mm to 0.5 mm to module thickness[9].
Edge-lit backlights are the mainstream choice for narrow-bezel designs, but their uniformity typically ranges from 75% to 85%. You may see visible brightness differences between corners and center.
Achieving 95% or higher uniformity requires direct-lit backlights or thicker light guide plates. This means balancing thickness, cost, and uniformity.
The IPS TFT product series from DisplayModule covers brightness levels from 250 to 1000 cd/m² for application-specific comparison[10].
Interface and Touch
Interface selection determines communication efficiency and pin count between the MCU and display module. The three most common interfaces in the embedded market are SPI, MCU 8080 series, and RGB.
Here is how they compare:
| Interface | Pin Count | Best For | Notes |
|---|---|---|---|
| SPI | 6 or 9 lines (fewest) | Low-resolution small displays, below 320×240 | Frame-rate limited |
| MCU 8080 (8/16-bit parallel) | Many GPIO pins | Higher resolution than SPI | 2x to 4x the speed of SPI |
| RGB | Direct pixel drive | Above 480×272 | Bypasses MCU frame buffer |
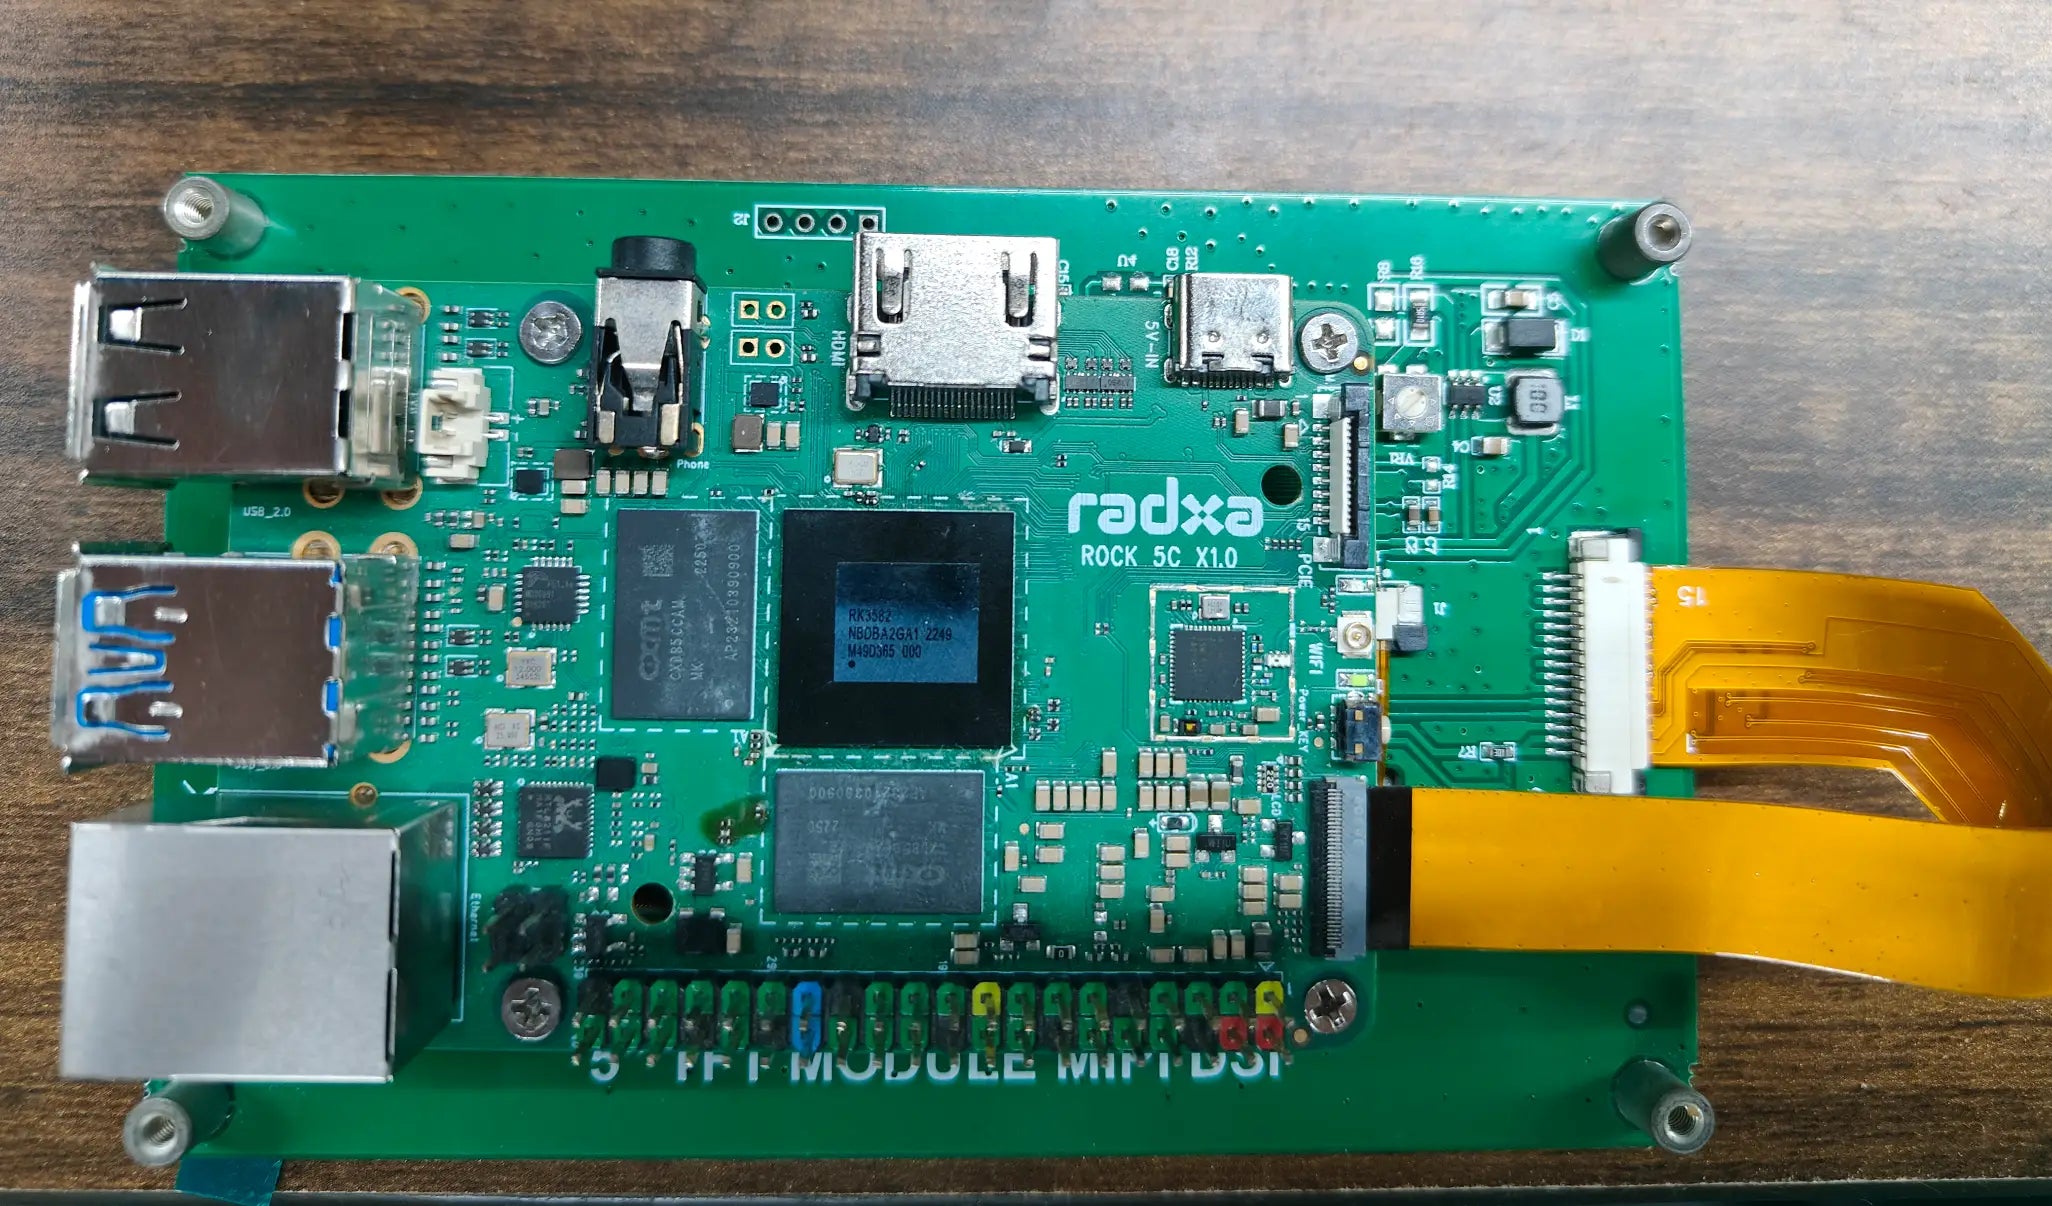
| MIPI DSI | High-speed serial differential | 5"+ at 720p or higher | Common in tablets and automotive[11] |
In a medical monitor project, we encountered an interface mismatch. The customer's AM335x processor only supported RGB output, but the selected panel only supported MIPI DSI.
This required an additional bridge chip that added $3.20 to the total cost[12].
Touch solutions fall into three main categories:
- Capacitive (PCAP) — accounts for approximately 80% of deployment. Favored for multi-touch support, >85% transmittance, and gloved-hand operation capability[13]. Sensitivity degrades on all-black surfaces or under strong light, requiring OCA full lamination.
- Resistive — still dominates in medical devices requiring frequent gloved disinfection and industrial environments with oil contamination[14].
- Infrared — used in specific niche applications.
Full lamination between the cover glass and touch sensor eliminates air-gap reflection and improves touch sensitivity by over 30%, but adds 3 to 5 days to lead time.
Using a standard model like the 2.8-inch 240×320 TFT with an integrated touch solution reduces development complexity when both touch and display customization are needed.
The final output of interface and touch definition is an Electrical Interface Specification Table. It covers pin definitions, timing diagrams, power supply requirements, and touch protocol version — 3 major categories totaling more than 20 parameters.
In our experience, interface ambiguity is the root cause of 85% of first-pass assembly failures in embedded display projects.
DisplayModule's Technical Knowledge Center provides datasheets and pinout reference diagrams for various interface schemes as a baseline for alignment[15].
Development Stage
Selecting Glass and IC
Glass panels and driver ICs are the two most critical components of an LCD display module. Their selection directly determines display quality, reliability, and cost.
Key glass parameters include:
- Glass thickness: typically 0.55 mm to 1.1 mm
- Twist type: TN / STN / FSTN / IPS
- Threshold voltage
- Segment definition
In an automotive aftermarket project, we learned this the hard way. The client chose a 4.3-inch 480×272 TN glass without noticing its operating temperature limit was only 70°C.
The actual dashboard temperature after sun exposure could reach 85°C. As a result, 37 out of 500 pilot units developed black spots[16].
Operating temperature range is the most frequently overlooked glass screening criterion. Standard range is -20°C to +70°C; wide-temperature range is -30°C to +85°C.
For IC selection, the driver IC must simultaneously support the display resolution, interface type, and frame rate. Key considerations include:
- GRAM size — directly determines addressable resolution
- Supported color depth — 65K, 262K, or 16.7M
- Frame rate
- Interface type
Major TFT driver IC suppliers include ILITEK, Novatek, Sitronix, and RAiO, each with different firmware versions and initialization codes[17].
We recommend asking suppliers for IC datasheets and initialization code snippets during the design phase, and verifying the I2C or SPI communication link on the target MCU platform before proceeding with FPC and PCB layout.
The IC market also faces periodic shortage risk. Popular models like ILI9341V and ST7789V experienced 6 to 8 week delivery delays in both 2021 and 2023.
Glass-IC compatibility can be verified through the supplier's COG (Chip on Glass) bonding solution. COG mounts the driver IC directly on the glass, eliminating external PCB and cables while reducing electromagnetic interference.
COG yield is heavily influenced by glass surface cleanliness and bonding pressure:
- Typical manufacturers achieve 92% to 96% yield.
- Mature producers maintain 98% or above[18].
The COG LCD product line from DisplayModule offers multiple glass-IC matching solutions covering character-type through graphic-type displays.
The article COG LCD for Medical Applications provides a detailed breakdown of selection criteria for COG solutions.
FPC Prototyping
The FPC (flexible printed circuit) bridges the glass and the main control board. Its design quality determines signal integrity and assembly reliability.
The three most important FPC design parameters are:
- Trace width / spacing — typically 0.1 mm / 0.1 mm to 0.12 mm / 0.12 mm
- Gold finger pitch — 0.5 mm to 1.0 mm
- Stiffener thickness — 0.2 mm to 0.3 mm PI
In a handheld ultrasound probe custom project, we initially designed the FPC output end with 0.5 mm pitch gold fingers. After more than 1000 insertion cycles the gold plating wore out and caused intermittent contact[19].
Switching to 0.8 mm pitch with thicker gold plating (0.25 μm to 0.5 μm) resolved the issue. FPC prototype lead time is typically 7 to 10 working days, expedited to 3 to 5 days.
FPC layer count depends on signal density:
- Simple 4:3 resistive touch panels need only 1 FPC layer.
- Capacitive touch plus driver interfaces require 2 to 4 layers.
Multi-layer FPCs require attention to shielding and impedance matching between signal layers. When transmitting high-speed signals like MIPI DSI, differential pair impedance must be maintained at 100 ± 10 Ω[20].
FPC routing should also include EMI shielding margin. In a medical ventilator project, an FPC trace running parallel to a power line for 30 mm without ground shielding coupled the DC-DC converter's switching frequency (approximately 1.2 MHz) into the signal lines, creating periodic screen ripple.
Adding a 0.05 mm copper foil shield layer reduced the interference amplitude by 26 dB and eliminated the ripple entirely.
FPC prototyping should also include simultaneous fabrication of test jigs. A test jig typically uses pogo pins to connect to the FPC and power the display for visual and touch functional verification without the main control board.
- Test jig cost ranges from 200 to 500 CNY.
- It quickly pays for itself by eliminating FPC wiring debugging time during system integration.
Cross-checking three documents — FPC signal definition, test jig interface drawing, and main board pinout — catches any misaligned signals during the sample stage[21].
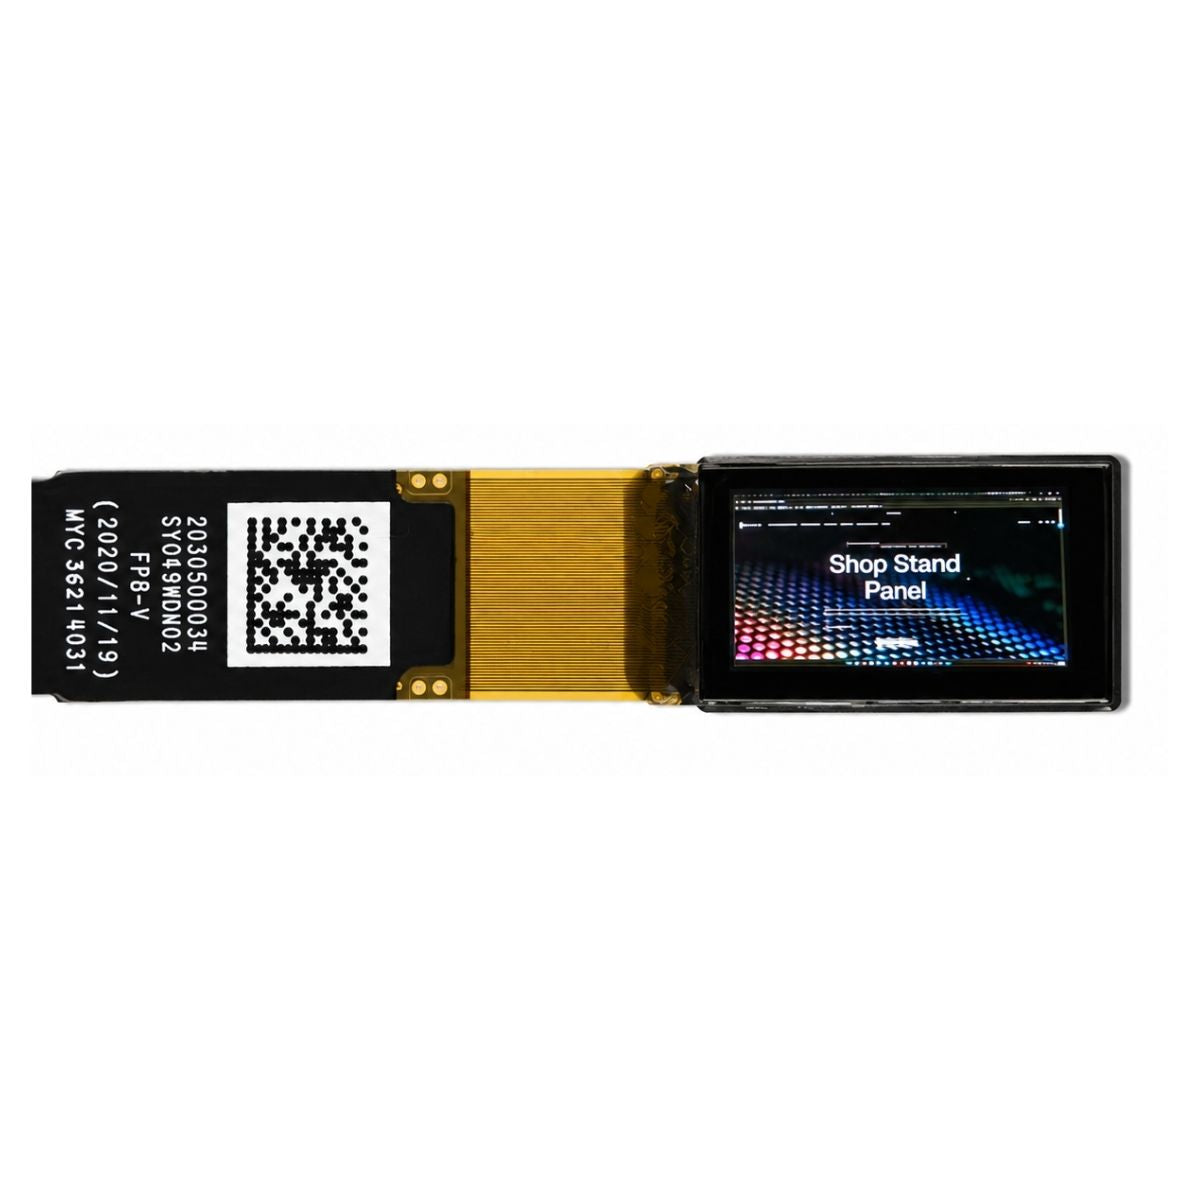
A small SPI-interface screen like the 1.27-inch OLED keeps FPC design relatively simple and is suitable for teams making their first custom display.
Backlight and Cover Glass
The backlight module directly determines the LCD display module's readability and power consumption. Core backlight design parameters include:
- LED count — 2 to 12
- Color temperature — typically 6500 K to 8000 K
- Brightness — 500 to 20000 mcd/LED
- Driving voltage — typical 3.0 V to 3.4 V
Edge-lit backlight is the most common structure in custom LCDs. The dot pattern density and distribution on the light guide plate directly affect uniformity.
In a self-service kiosk project, the initial light guide plate had dots only at the bottom. The upper half of the screen was roughly 25% darker than the lower half, with a visible brightness boundary line[22].
Switching to a laser-etched dot pattern improved uniformity to 88%. Backlight module thickness depends on LED count and light guide plate thickness. Typical edge-lit backlight thickness ranges from 1.0 mm to 3.0 mm.
Cover glass (or cover lens) serves both protective and optical roles in touch display solutions. Typical cover glass thickness ranges from 0.7 mm to 1.8 mm.
Material choices include:
- Standard soda-lime glass — lower cost
- Chemically strengthened glass (e.g., Corning Gorilla Glass) — applications requiring scratch resistance should use 1.1 mm or thicker, achieving surface hardness of 6H or greater[23]
Cover glass processing involves 5 to 8 steps:
- CNC cutting
- Chamfering
- Polishing
- Silk-screening
- AR/AF coating
Lead time is typically 10 to 15 days. Full lamination between cover glass and touch sensor can use OCA or OCR:
- OCA (optically clear adhesive film) — lower cost and higher yield, but only suits flat surfaces.
- OCR (liquid optically clear resin) — can cover curved and irregular surfaces, but requires tighter process control.
Backlight and cover glass combinations must account for total module thickness constraints on product enclosure design. A complete display stack (backlight + glass + polarizer + touch + cover lens) typically measures between 2.5 mm and 5.5 mm.
In a portable barcode scanner project, we optimized thickness down to 2.3 mm using:
- 0.4 mm glass
- 1.0 mm ultra-thin backlight
- 0.7 mm cover glass
- 0.2 mm OCA adhesive
But brightness was about 15% lower than the standard solution[24].
The trade-off between thickness and brightness must be made based on the actual application scenario.
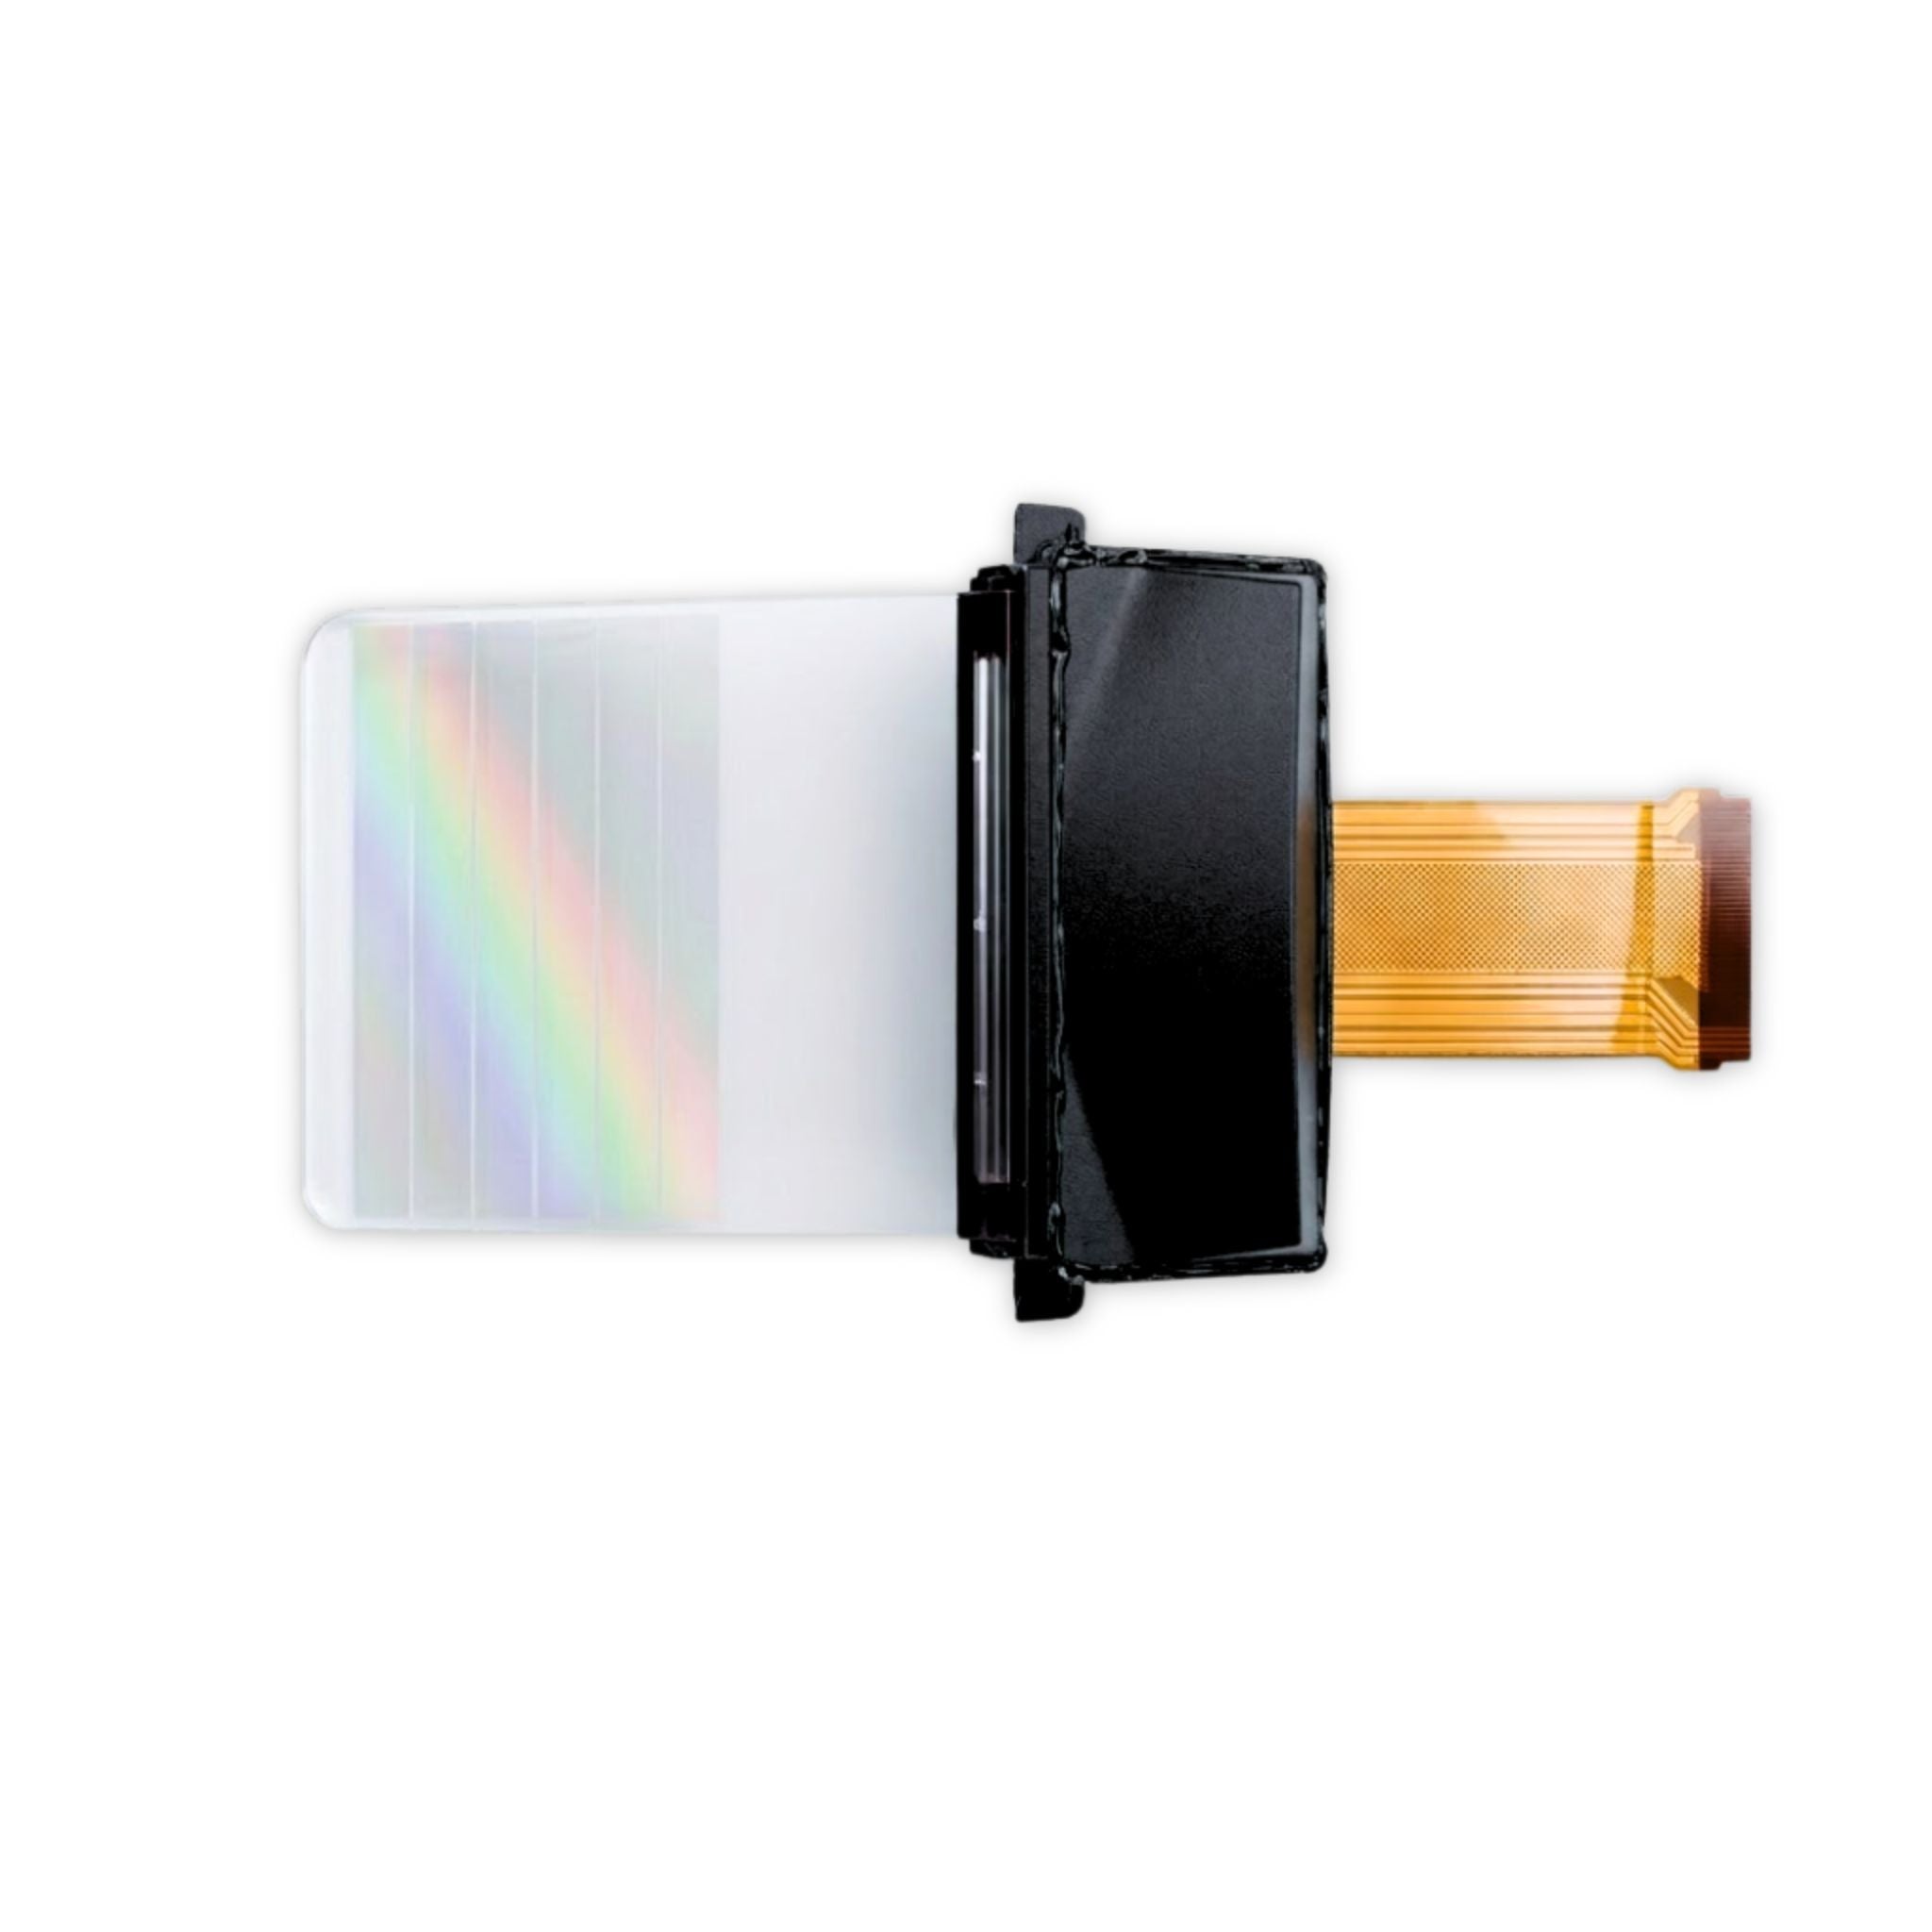
For projects with strict requirements on backlight uniformity and thickness, the article Micro OLED Brightness Analysis provides detailed calculation methods for optical efficiency and brightness loss.
Mass Production Preparation
Sample Validation Testing
Sample validation is the critical milestone that transforms the development-stage technical solution into mass production feasibility. A complete sample validation covers optical, electrical, and reliability dimensions.
Optical validation measures brightness, chromaticity, contrast ratio, viewing angle, and uniformity point by point. This uses a color analyzer (e.g., Konica Minolta CA-310 or CS-200) under darkroom conditions with a 9-point or 13-point grid method[25].
In a smart home project, the datasheet claimed 500 cd/m² but actual measurement showed only 412 cd/m² — a discrepancy of 17.6%. Investigation revealed that the supplier used 100% duty cycle and 20 mA/LED as test conditions, while our actual circuit only supplied 16 mA.
Sample validation must be performed under the product's actual operating conditions, not the datasheet's typical values.
Electrical performance validation focuses on power consumption, EMI radiation, and signal integrity. Power consumption should be measured under different display patterns (full white, full black, checkerboard).
Third-party laboratory data show that a 5-inch TFT draws approximately 120 mA to 160 mA total current on a full-white screen and 80 mA to 110 mA on a full-black screen. The difference is primarily attributed to TFT pixel capacitance charging[26].
Signal integrity testing should at minimum examine the eye diagram of MISO/MOSI data lines to ensure no timing violations across the production temperature range.
For battery-powered devices with strict power budgets, the PMOLED Power Estimation article provides accurate power calculation formulas for PMOLED displays.
Reliability validation includes at least three tests:
| Test Type | Conditions |
|---|---|
| High-temperature & high-humidity | 65°C / 90% RH for 240 hours |
| Temperature cycling | -20°C to +70°C, 100 cycles |
| Mechanical vibration | 10 Hz to 500 Hz sweep, 30 minutes per axis[27] |
These three tests expose most early-life failures, including FPC bonding peeling, backlight LED solder joint cracks, and polarizer blistering.
After passing sample validation, a formal Sample Test Report should be issued within 2 weeks as the gate condition for tooling development.
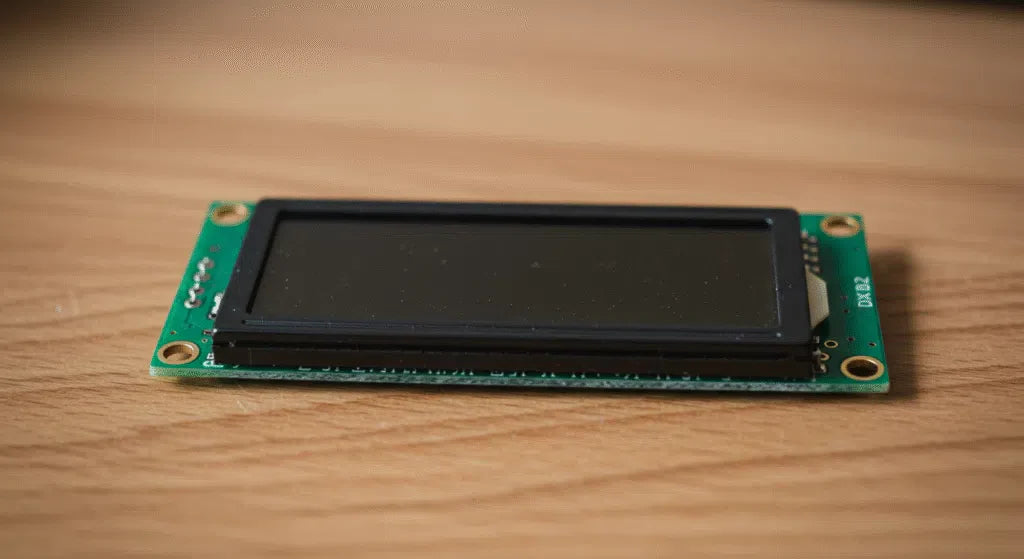
Using a mature standard product like the 20x4 Character LCD for functional verification during the sample stage reduces the uncertainty of the custom solution.
Molds and Jigs
Once sample validation passes and the design is frozen, mass production mold and jig development can proceed. Custom display modules involve four main types of tooling:
| Tooling Type | Lead Time | Cost |
|---|---|---|
| Backlight light guide plate injection mold | 20–30 days | 8,000–25,000 RMB[28] |
| FPC die-cutting mold | 7–10 days | 1,500–5,000 RMB |
| Cover glass CNC jig | — | — |
| Touch sensor screen-printing jig | — | — |
Tooling costs are typically borne by the client and amortized over the first production order. A return-on-investment assessment between tooling investment and expected order volume is recommended.
For jigs, at least four dedicated fixtures should be created:
- FPC bonding alignment jig
- COG placement jig
- Backlight assembly jig
- Final module pressing jig
In a smart lock project, the absence of an FPC bonding alignment jig meant operators aligned the FPC by eye. This resulted in a first-pass yield of only 68% and an FPC misalignment rate of 12%[29].
Introducing an alignment jig reduced the misalignment rate to 0.5%. Jig fabrication costs are relatively low, typically 500 to 2,000 RMB per set, but their impact on yield is decisive.
We recommend incorporating jig fabrication and usage into the SOP management system with defined usage frequency and calibration cycles.
Custom-shaped displays like the 1.2-inch Round AMOLED require special attention to structural alignment precision during mold development.
Mold development should proceed in parallel with the creation of a Production Control Plan. This document specifies process parameter limits, inspection frequency, and reaction rules for each station.
For example, the FPC bonding station must control three parameters:
- Temperature zone: 180°C ± 5°C
- Pressure: 3.0 kgf/cm² ± 0.5 kgf/cm²
- Dwell time: 5 s ± 1 s[30]
The Production Control Plan should also include first-article inspection (FAI) requirements and patrol inspection frequency for each station.
We recommend a pilot run of 100 to 300 units after all tooling and jigs are in place. This verifies mold stability and jig compatibility while collecting key dimensional data for SPC control.
Incoming Inspection and QC
Incoming quality control (IQC) is the first line of defense in mass production. A typical custom display module project sources 7 to 10 categories of materials:
- Glass panels
- Driver ICs
- FPC substrates
- LEDs
- Light guide plates
- Polarizers
- Cover glass
Each material category should have a corresponding inspection standard covering key dimensions (±0.1 mm tolerance), visual defect criteria (dot/line/bubble diameter limits), and packaging method.
In an automotive project, mixed batches of C2 chips from 2022 and 2023 revisions entered production. The two revisions had different SCS register addresses, causing vertical streaking after batch assembly lighting[31].
Investigation showed the IQC team had only verified part number and quantity without checking revision or batch code. We added a "version-to-datasheet consistency" check item to the incoming inspection instruction, requiring FAI to verify three key register values against the IC datasheet.
In-process quality control (IPQC) covers four critical stations:
- Bonding
- Lamination
- Assembly
- Lighting inspection
Each station should define control points (CPs) and process capability index (CPK) targets. For COG bonding, the CPK target is typically ≥ 1.33 (corresponding to 63 ppm defect rate).
If CPK falls below 1.0 for five consecutive batches, production should stop for parameter adjustment[32].
Lighting inspection is the most critical OQC step. We recommend the grayscale pattern detection method:
- Manually inspect under four patterns: full black, full white, 50% gray, and RGB primary colors.
- Look for bright dots, dark dots, line defects, and Mura.
- Each module should be inspected for at least 30 seconds.
Rushing through in 8 seconds, as happened in one intercom project, caused approximately 3% of units with intermittent line-blanking issues to go undetected until final assembly at the customer site[33].
Closed-loop quality data management is the foundation for continuous improvement.
IQC, IPQC, and OQC defect data should be consolidated into a unified database. Monthly analysis of each station's first-pass yield (FPY) and top three defect types is recommended.
In our analysis of 15 custom display projects completed over the past 18 months, the two most recurring issues were:
- FPC bonding defects
- Backlight LED solder joint defects
Together they accounted for 54% of all defects[34].
We recommend that custom clients arrange an on-site visit during the early production ramp to participate in first-article inspection and data review. This significantly reduces the production ramp-up learning curve.
DisplayModule supports on-site inspection at its Ningbo factory with real-time access to all quality data[35].
For specific AMOLED quality control requirements during mass production, the article AMOLED Custom Solution Guide includes a complete set of AMOLED quality control checkpoints.
Weiterlesen
Round AMOLED displays are becoming a common choice for smart wearables and compact embedded devices. They are thin, high-contrast, fast in response, and more flexible in shape than traditional rect...
Across 12 AR-glasses prototype builds we bench-tested 28 Micro OLED microdisplays, and only 14 of them made it cleanly into a waveguide or BirdBath optical engine — a 50% pass rate. Of the 14 rejec...
Hinterlasse einen Kommentar
Diese Website ist durch hCaptcha geschützt und es gelten die allgemeinen Geschäftsbedingungen und Datenschutzbestimmungen von hCaptcha.